Broad strokes, 2011-2026

My scientific journey at the Broad through 95 papers, and my favorite figure from each.

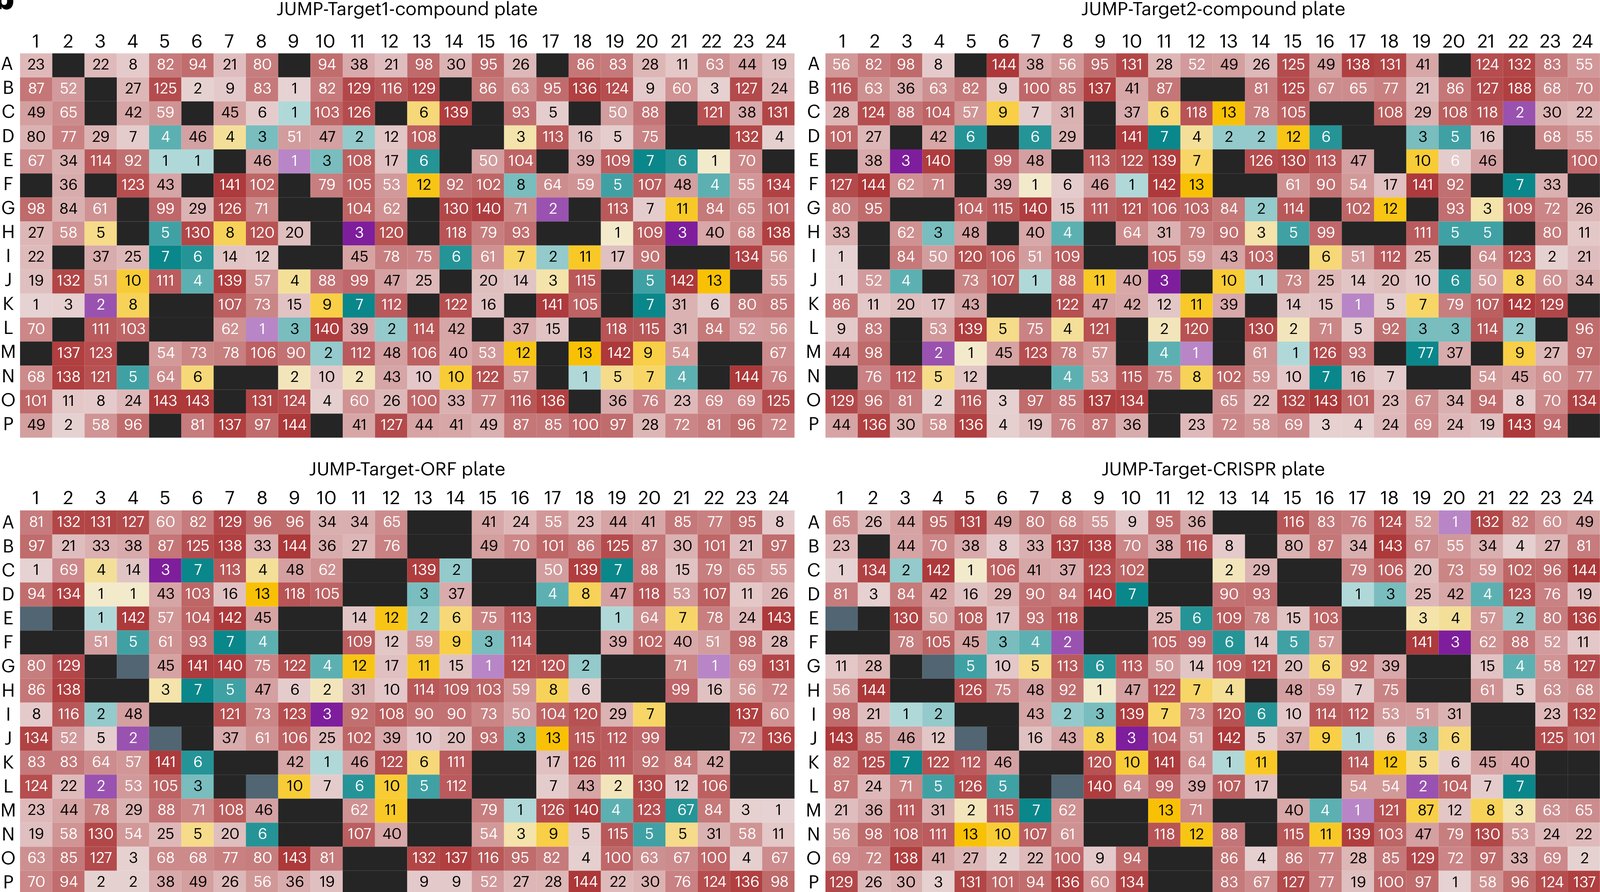
123456789101112 ABCDEFGH

Hover a well for the paper, click it for the card. The cards show each figure as published, and clicking a figure opens it at full size.

Each figure has a story about why I picked it. I have written only the first, A1; the others I am saving as a treat for someday.

2013

Figure 3 from Comparison of Methods for Image-Based Profiling of Cellular Morphological Responses to Small-Molecule Treatment
Figure 3.

2013, Journal of Biomolecular Screening. Well A1.

Comparison of Methods for Image-Based Profiling of Cellular Morphological Responses to Small-Molecule Treatment

Vebjorn Ljosa, Peter D. Caie, Rob ter Horst, Katherine L. Sokolnicki, Emma L. Jenkins, Sandeep Daya, Mark E. Roberts, Thouis R. Jones, Shantanu Singh, Auguste Genovesio, Paul A. Clemons, Neil O. Carragher, Anne E. Carpenter

Read the paper

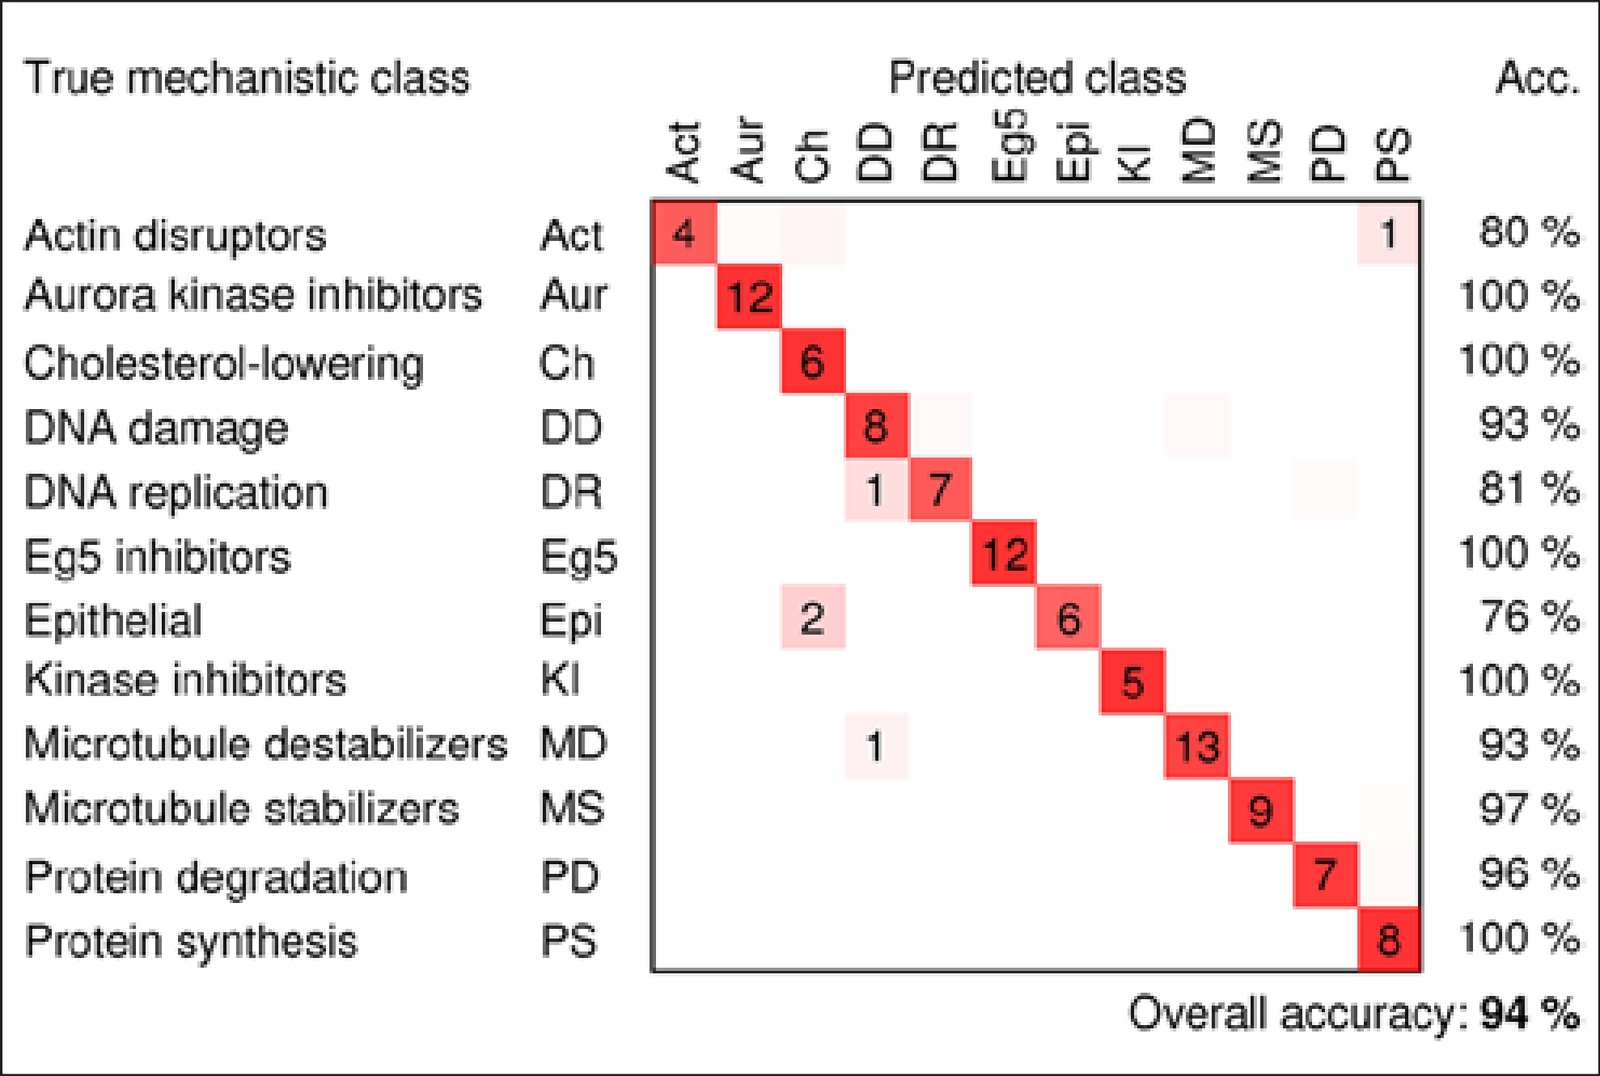
We compared five ways to combine single-cell measurements from microscope images into one profile per sample by how well each predicted a drug's mechanism of action, the way it acts on cells. In treated breast cancer cells, simply averaging each measurement did as well as methods modeling single cells. Applying factor analysis before averaging worked best, predicting the mechanism correctly for 94% of treatments with known mechanisms. We released the data and open-source code.

Caption

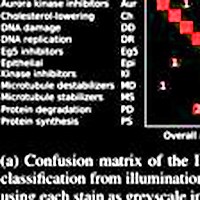
Confusion matrix for the factor-analysis method, showing the number of compound concentrations that were classified correctly (on the diagonals) and incorrectly (off the diagonals), the classification accuracies for each mechanism of action (right columns), and overall classification accuracy (number of correctly classified compound concentrations divided by the total number of compound concentrations). Average outcomes over 20 models are shown; dimly colored squares without numbers indicate classification outcomes that occurred fewer than 0.5 times on average.

Reflections

I picked the confusion matrix because it was the most evocative figure for me, in this paper and in many that followed. I remember Vebjorn had very carefully crafted its graphics using Cairo. It was my first paper at the Broad: I'd come in excited about scaling up cell imaging, had convinced Anne and Carolina to bring me on, and was thrilled to find datasets already collected. I'd been pushing these ideas during my PhD, inspired by Steve Altschuler and Lani Wu, but was constrained to hundreds of cells imaged by hand. Now we had tens of thousands, ready to go.

The confusion matrix overstates how well we could separate compounds by mechanism; our goal was simply to show that the obvious things could be done. Hard to believe now, but back then it wasn't at all clear we could distinguish compounds by phenotype. The dataset went on to become the famous BBBC021, heavily used for the next decade in image-based profiling.

Citation

Vebjorn Ljosa, Peter D. Caie, Rob ter Horst, Katherine L. Sokolnicki, Emma L. Jenkins, Sandeep Daya, Mark E. Roberts, Thouis R. Jones, Shantanu Singh, Auguste Genovesio, Paul A. Clemons, Neil O. Carragher, Anne E. Carpenter. Comparison of Methods for Image-Based Profiling of Cellular Morphological Responses to Small-Molecule Treatment. Journal of Biomolecular Screening 18, 1321-1329 (2013). https://doi.org/10.1177/1087057113503553

Back to the plate

2014

Figure 2 from Increasing the Content of High-Content Screening: An Overview
Figure 2.

2014, Journal of Biomolecular Screening. Well A2.

Increasing the Content of High-Content Screening: An Overview

Shantanu Singh, Anne E. Carpenter, Auguste Genovesio

Read the paper

Caption

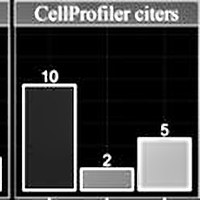
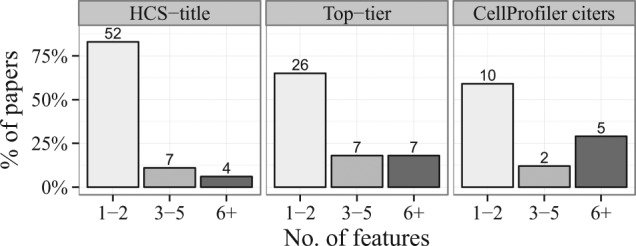
Feature set sizes used in papers throughout the three searches. Numbers at the top of each bar indicate the actual number of papers. Between 60% and 80% of the papers used only one or two measured features of the cells.

Citation

Shantanu Singh, Anne E. Carpenter, Auguste Genovesio. Increasing the Content of High-Content Screening: An Overview. Journal of Biomolecular Screening 19, 640-650 (2014). https://doi.org/10.1177/1087057114528537

Back to the plate

Figure 1 from Pipeline for illumination correction of images for high‐throughput microscopy
Figure 1.

2014, Journal of Microscopy. Well A3.

Pipeline for illumination correction of images for high‐throughput microscopy

S. Singh, M.-A. Bray, T.R. Jones, A.E. Carpenter

Read the paper

Caption

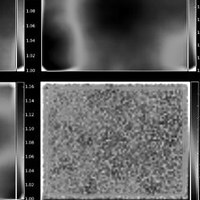
Estimating illumination correction functions. Sample ICFs for DAPI (top-left), actin (top-right) and tubulin (bottom-left). The image dimensions are 1280 × 1024 pixels. To generate an ICF, the mean image across all images in a plate is smoothed using a median filter with window size = 500 pixels. The value of this parameter was chosen manually as follows. Start with filter dimensions approximately 25% that of the image, then increase the dimensions in increments of about 10% of the image size until the ICFs appear smooth overall; the presence of bright ‘blotches’ in the ICF indicates that the local cellular intensities still dominate the global illumination pattern or that artefacts are present. The density of cells across the field-of-view is uniform (bottom-right). This check is important to confirm that there are no systematic uneven cell distribution patterns that could lead to erroneous ICFs.

Citation

S. Singh, M.-A. Bray, T. R. Jones, A. E. Carpenter. Pipeline for illumination correction of images for high-throughput microscopy. Journal of Microscopy 256, 231-236 (2014). https://doi.org/10.1111/jmi.12178

Back to the plate

2015

Figure 5 from Morphological Profiles of RNAi-Induced Gene Knockdown Are Highly Reproducible but Dominated by Seed Effects
Figure 5.

2015, PLoS ONE. Well A4.

Morphological Profiles of RNAi-Induced Gene Knockdown Are Highly Reproducible but Dominated by Seed Effects

Shantanu Singh, Xiaoyun Wu, Vebjorn Ljosa, Mark-Anthony Bray, Federica Piccioni, David E. Root, John G. Doench, Jesse S. Boehm, Anne E. Carpenter

Read the paper

Caption

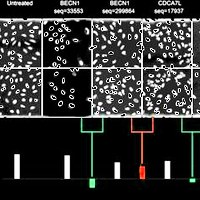
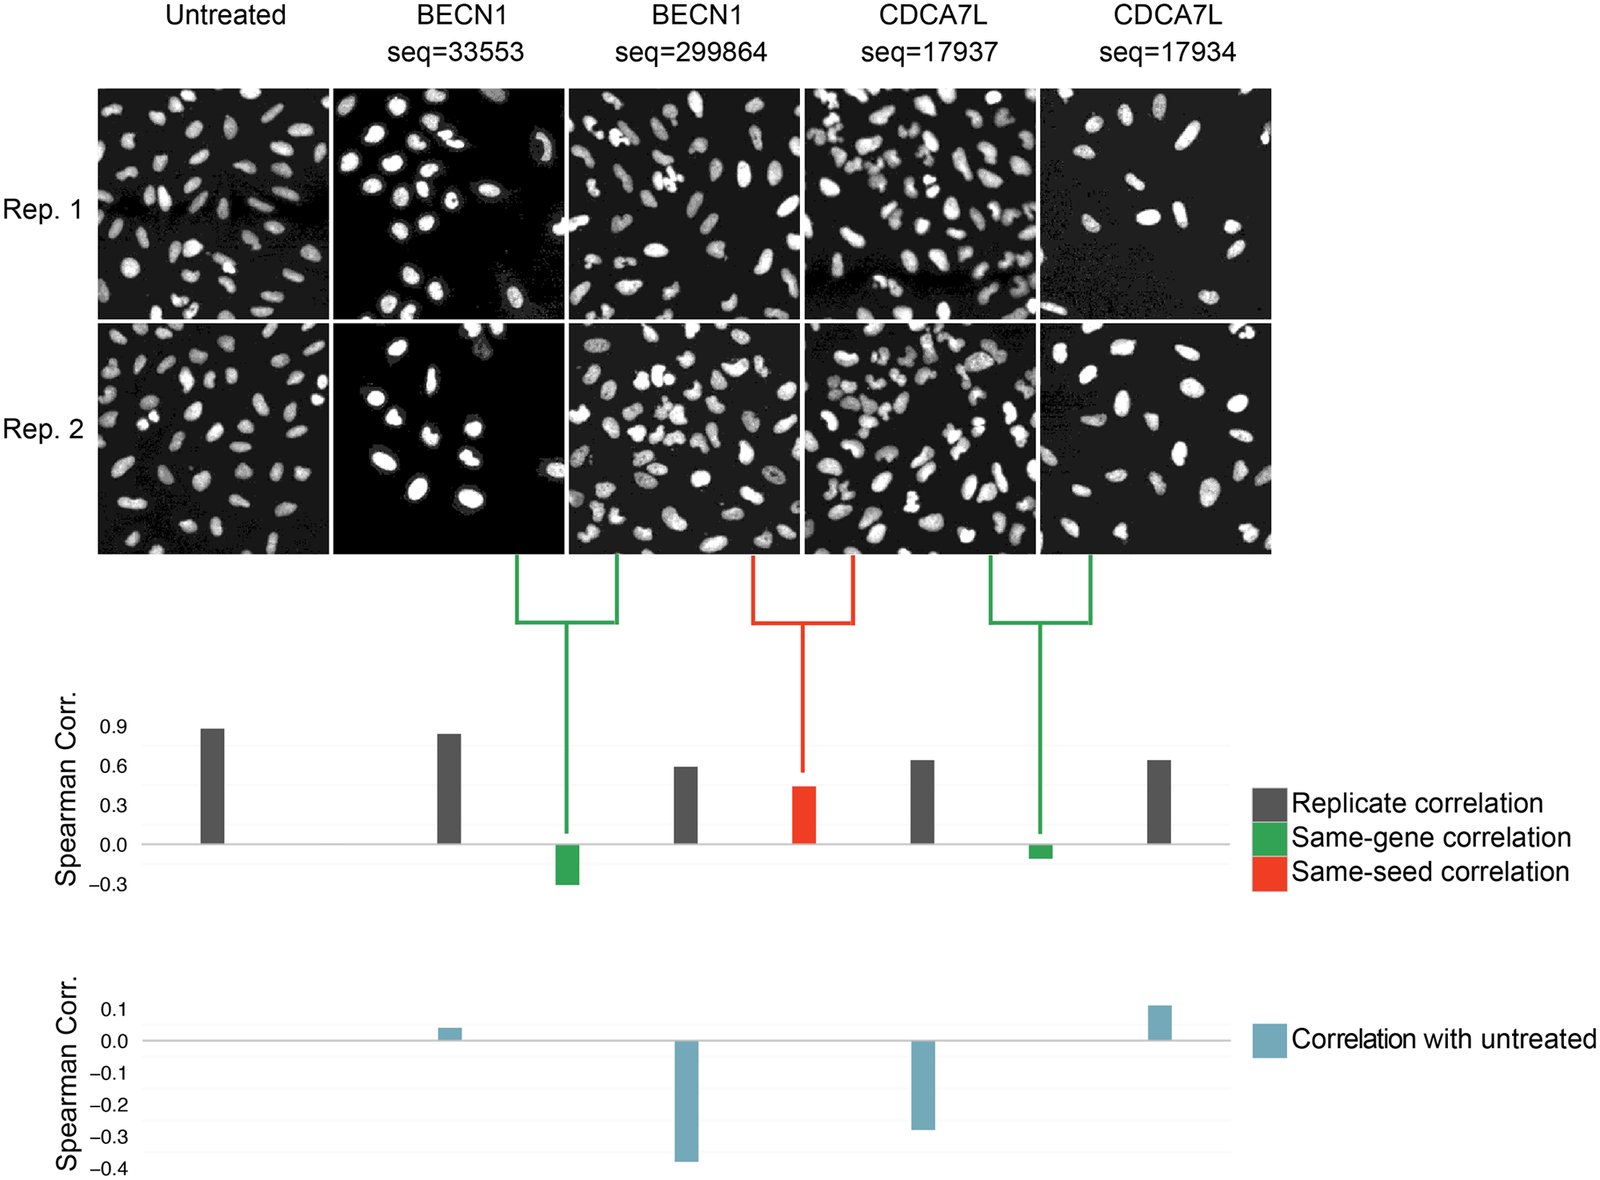
Visual example of seed effects dominating morphological profiles. Only nuclear shape features were used in this example in order to yield visually interpretable phenotypes. Two of the shRNA sequences targeting CDCA7L and BECN1 share a seed sequence (sequences 299864 and 17937 have a common seed GAATGA at nucleotides 12–17). The Spearman correlation between the morphological profiles of these shRNAs is high (seed correlation = 0.44, red bar). For each of these two shRNAs, a same-gene shRNA with a dissimilar phenotype is also shown (same-gene shRNA correlation = -0.31 and -0.11, green bars). All four shRNAs have high replicate correlation and are dissimilar from untreated cells. We specifically chose an example where the seed correlation is high and the same-gene shRNA correlations are low; however this phenomenon is seen globally (Fig 3). Images have been zoomed in, showing only 2% of the imaged region.

Citation

Shantanu Singh, Xiaoyun Wu, Vebjorn Ljosa, Mark-Anthony Bray, Federica Piccioni, David E. Root, John G. Doench, Jesse S. Boehm, Anne E. Carpenter. Morphological Profiles of RNAi-Induced Gene Knockdown Are Highly Reproducible but Dominated by Seed Effects. PLoS ONE 10, 0131370 (2015). https://doi.org/10.1371/journal.pone.0131370

Back to the plate

2016

Figure 1 from CP-CHARM: segmentation-free image classification made accessible
Figure 1.

2016, BMC Bioinformatics. Well A5.

CP-CHARM: segmentation-free image classification made accessible

Virginie Uhlmann, Shantanu Singh, Anne E. Carpenter

Read the paper

Caption

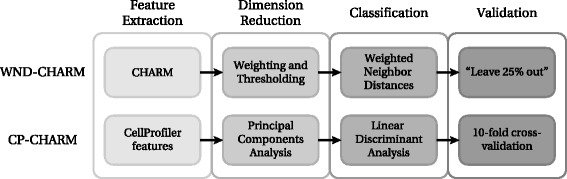
Comparison between WND-CHARM [10] and the CP-CHARM algorithm presented in this paper. The overall construction of the algorithm is retained, but individual operations have been modified.

Citation

Virginie Uhlmann, Shantanu Singh, Anne E. Carpenter. CP-CHARM: segmentation-free image classification made accessible. BMC Bioinformatics 17, 51 (2016). https://doi.org/10.1186/s12859-016-0895-y

Back to the plate

Figure 1 from Applications in image-based profiling of perturbations
Figure 1.

2016, Current Opinion in Biotechnology. Well A6.

Applications in image-based profiling of perturbations

Juan C Caicedo, Shantanu Singh, Anne E Carpenter

Read the paper

Caption

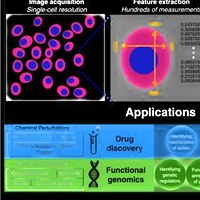
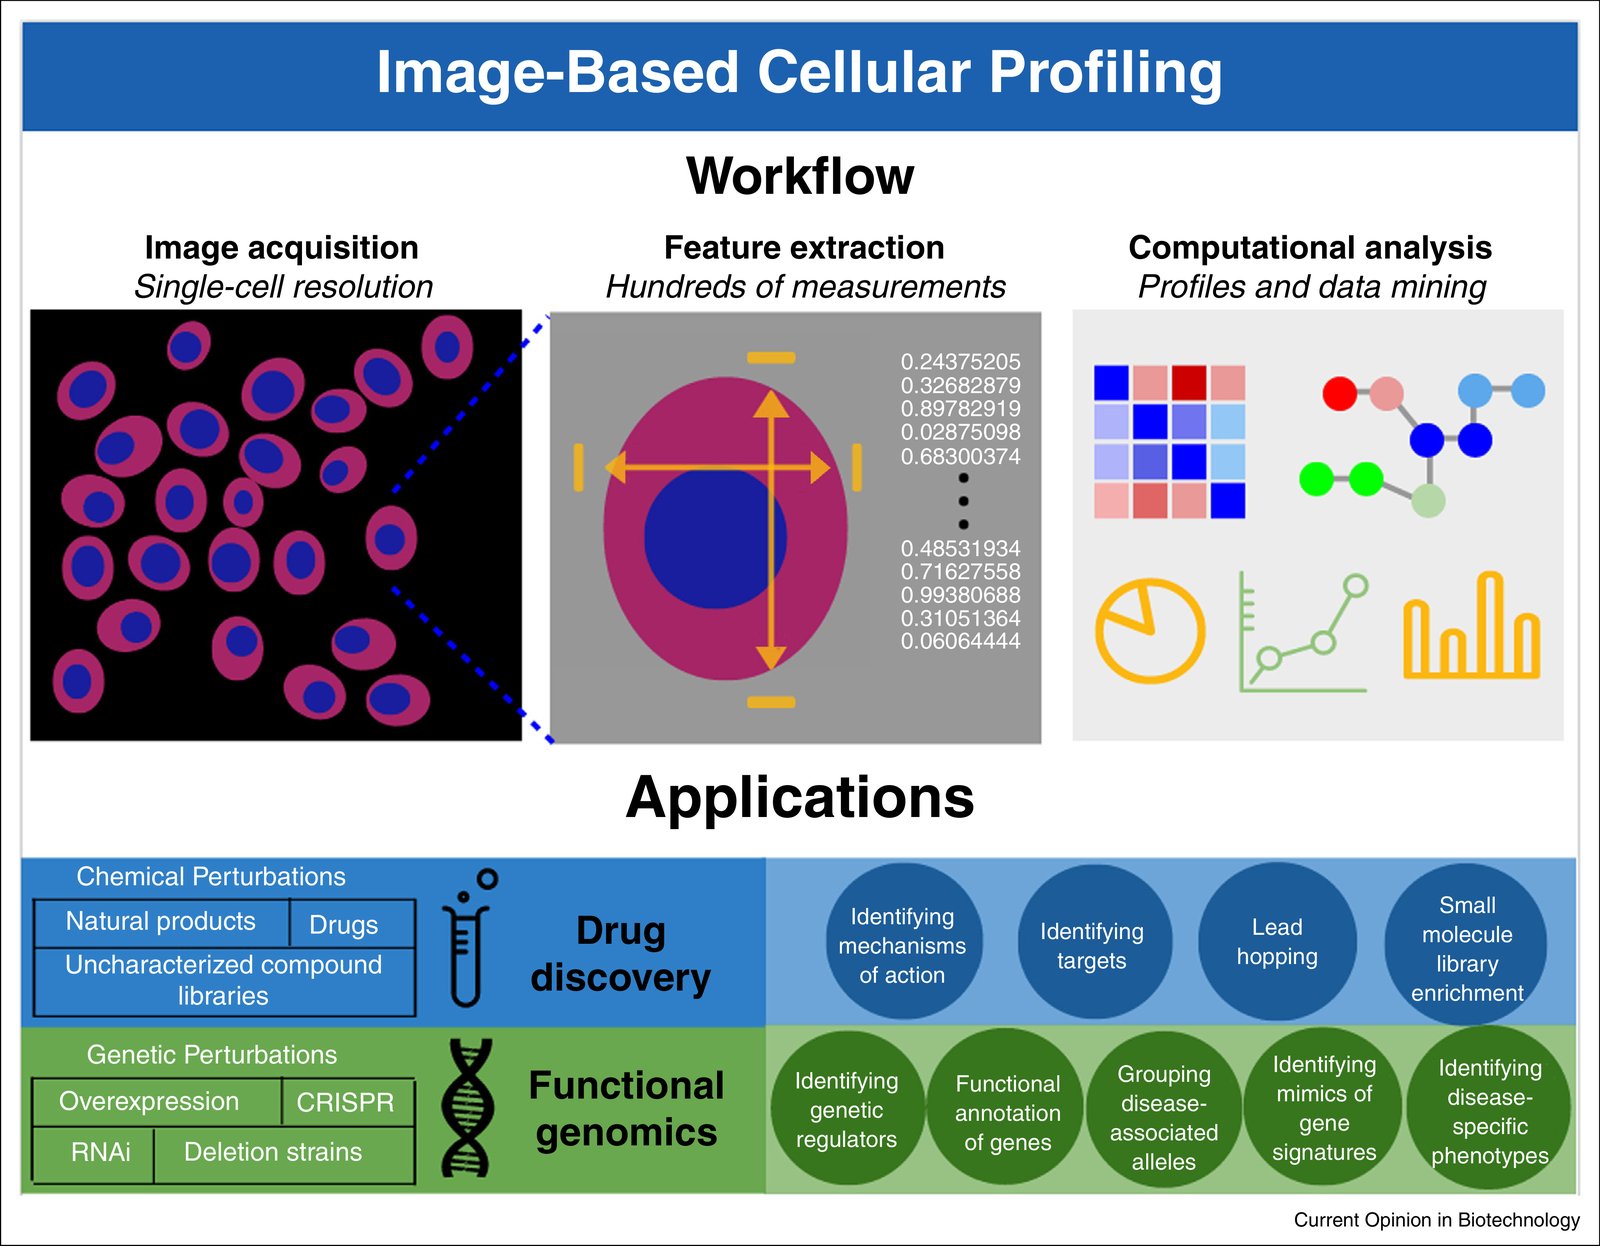
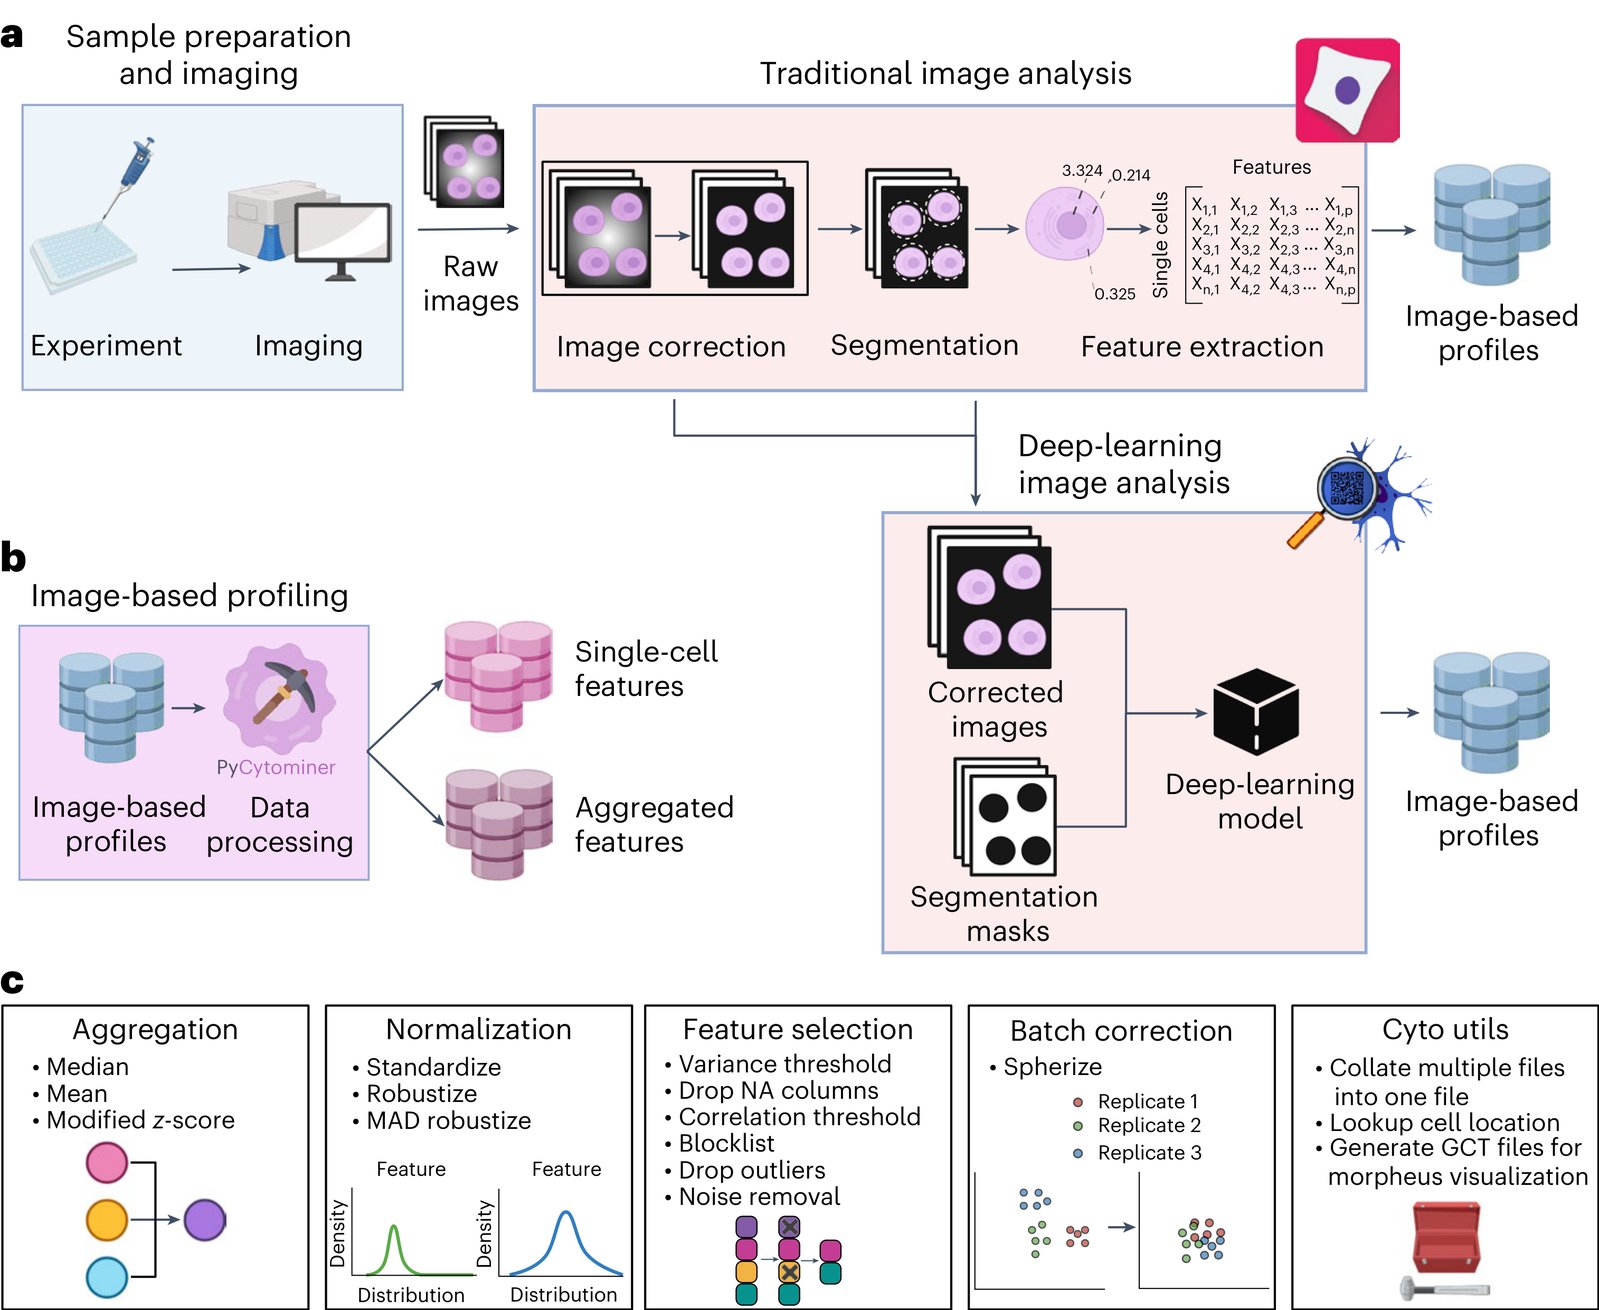
Image-based profiling workflow and applications. Perturbations are applied to a population of cells or organisms, and the resulting phenotypes are observed and captured with imaging. Hundreds of morphological measurements are extracted from images, which are then analyzed using computational models, appropriate to the target application. Those models are used to draw conclusions in a diverse range of biomedical applications.

Citation

Juan C. Caicedo, Shantanu Singh, Anne E. Carpenter. Applications in image-based profiling of perturbations. Current Opinion in Biotechnology 39, 134-142 (2016). https://doi.org/10.1016/j.copbio.2016.04.003

Back to the plate

Figure 1 from CellProfiler Analyst: interactive data exploration, analysis and classification of large biological image sets
Figure 1.

2016, Bioinformatics. Well A7.

CellProfiler Analyst: interactive data exploration, analysis and classification of large biological image sets

David Dao, Adam N. Fraser, Jane Hung, Vebjorn Ljosa, Shantanu Singh, Anne E. Carpenter

Read the paper

Caption

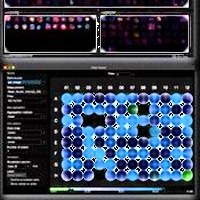
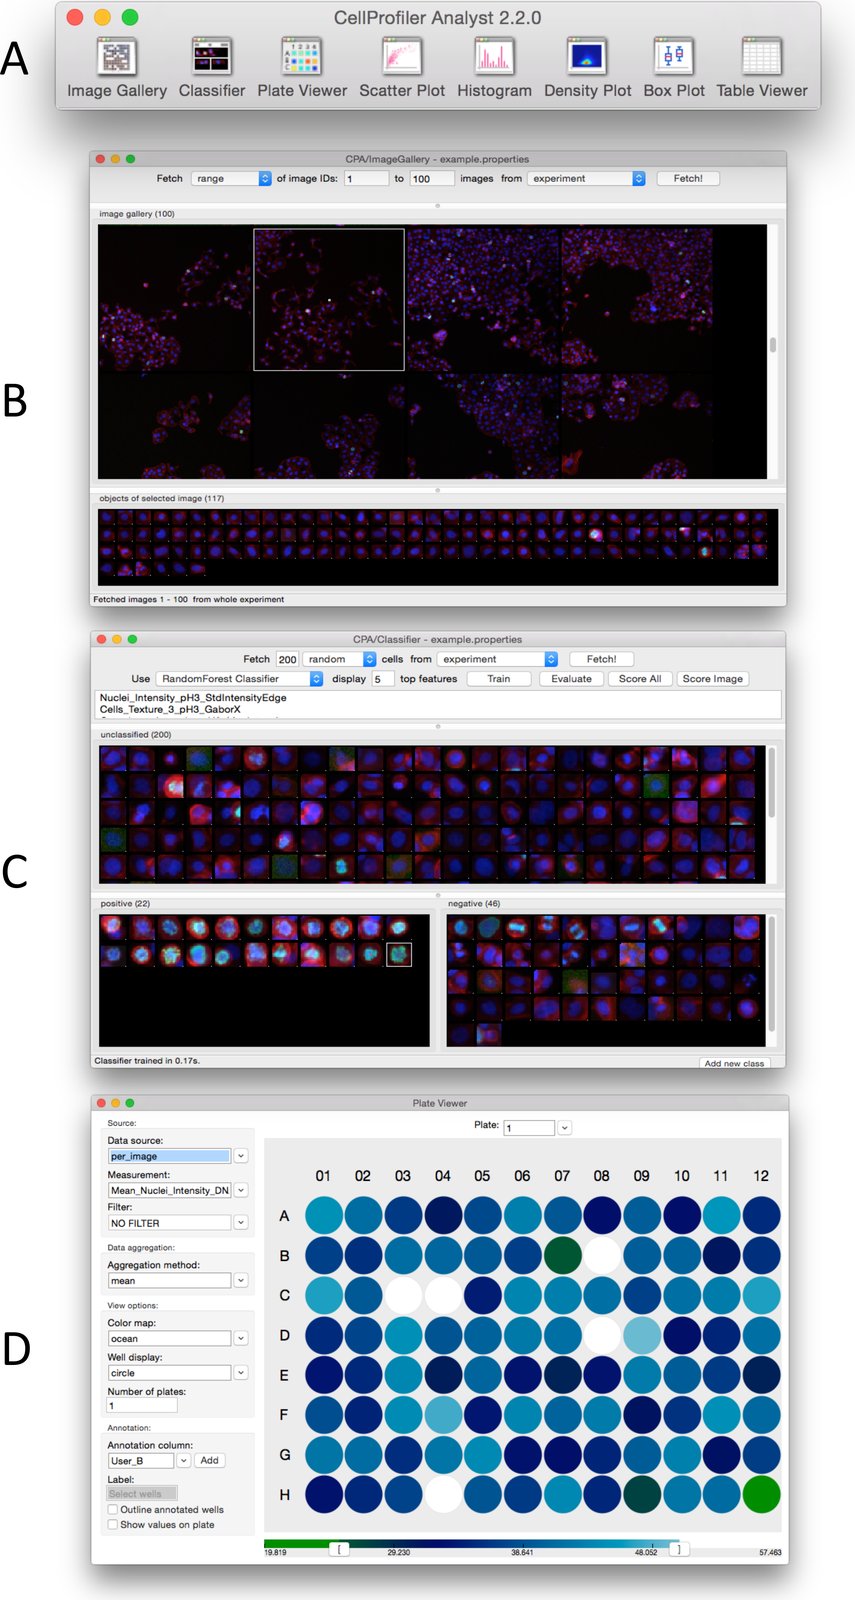
User Interface of CellProfiler Analyst. (A) Main Toolbar and Image Gallery; (B) Classifier; (C) Plate Viewer.

Citation

David Dao, Adam N. Fraser, Jane Hung, Vebjorn Ljosa, Shantanu Singh, Anne E. Carpenter. CellProfiler Analyst: interactive data exploration, analysis and classification of large biological image sets. Bioinformatics 32, 3210-3212 (2016). https://doi.org/10.1093/bioinformatics/btw390

Back to the plate

Figure 2 from High-throughput Phenotyping of Lung Cancer Somatic Mutations
Figure 2. This image is part of the figure, and the caption describes the whole figure.

2016, Cancer Cell. Well A8.

High-throughput Phenotyping of Lung Cancer Somatic Mutations

Alice H. Berger, Angela N. Brooks, Xiaoyun Wu, Yashaswi Shrestha, Candace Chouinard, Federica Piccioni, Mukta Bagul, Atanas Kamburov, Marcin Imielinski, Larson Hogstrom, Cong Zhu, Xiaoping Yang, Sasha Pantel, Ryo Sakai, Jacqueline Watson, Nathan Kaplan, Joshua D. Campbell, Shantanu Singh, David E. Root, Rajiv Narayan, Ted Natoli, David L. Lahr, Itay Tirosh, Pablo Tamayo, Gad Getz, Bang Wong, John Doench, Aravind Subramanian, Todd R. Golub, Matthew Meyerson, Jesse S. Boehm

Read the paper

Caption

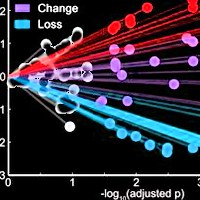
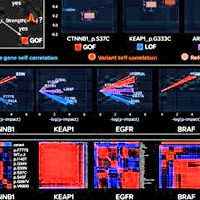
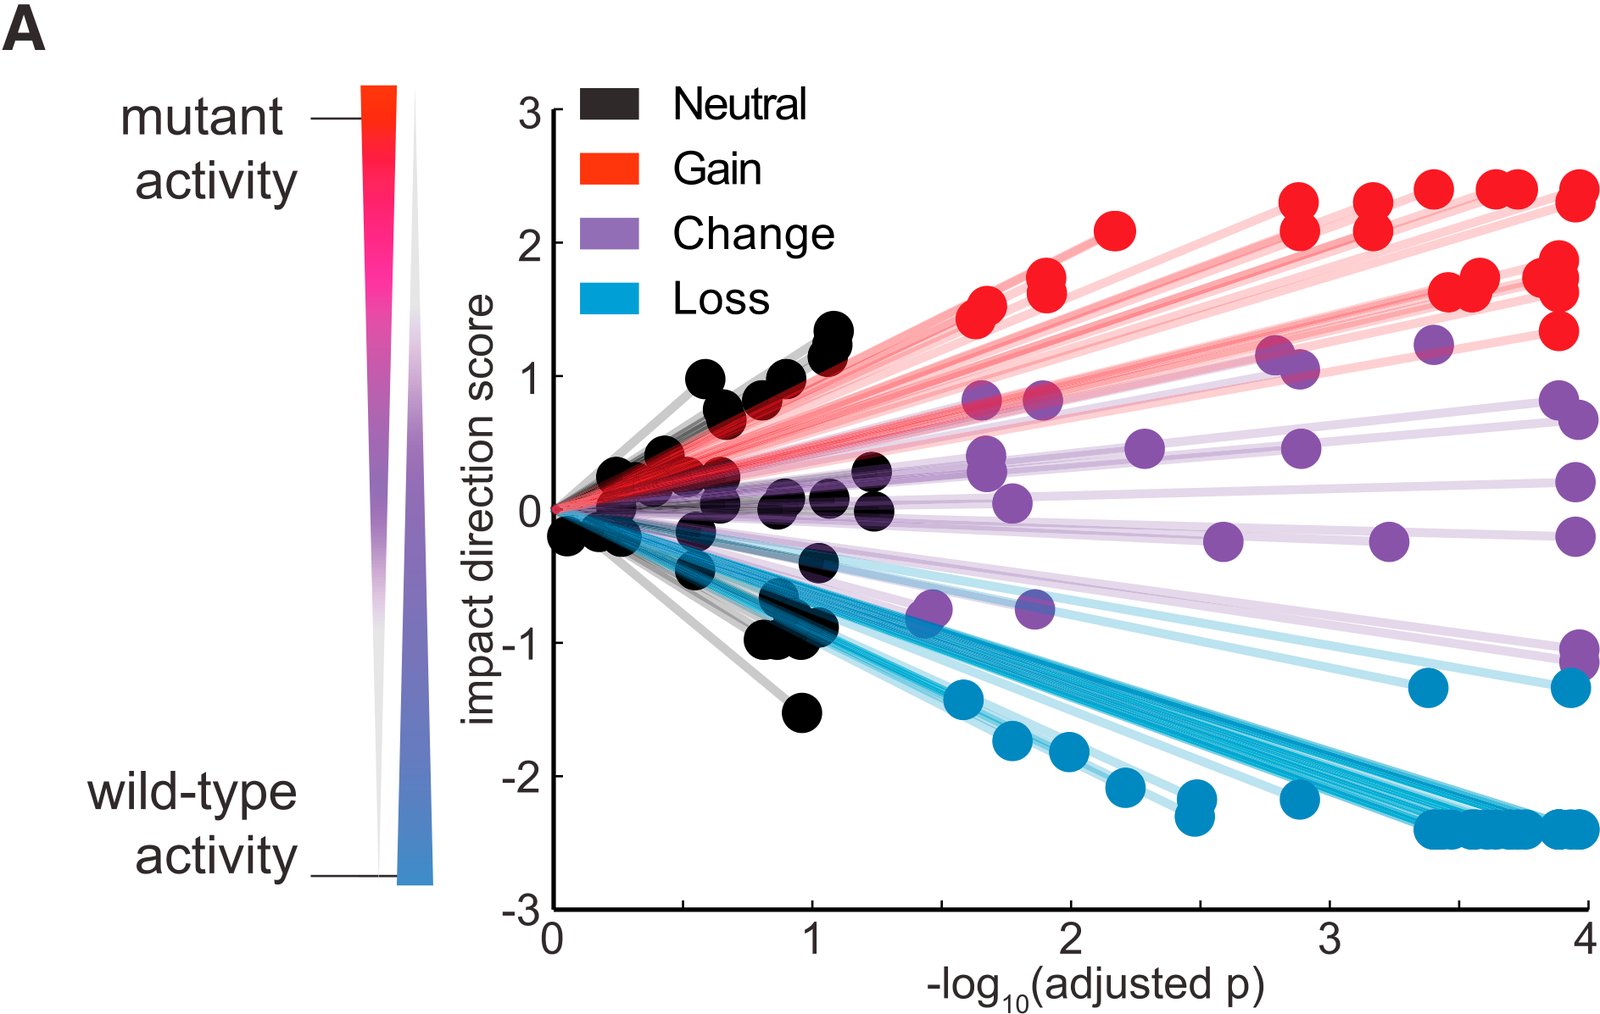
eVIP Classifications for 110 Lung Cancer Somatic Mutations. (A) A ‘‘sparkler’’ plot representation of eVIP predictions. Each variant allele with an eVIP prediction is represented as a point. The x axis indicates the –log10 (adjusted p) of a Kruskal-Wallis test comparing wild-type and mutant ORF replicate consistency and signature identity. The y axis is the ‘‘impact direction score,’’ the absolute value of which is equal to the –log10 (adjusted p) of a Wilcoxon test directly comparing wild-type and mutant ORF replicate consistency. The sign of the impact direction score is positive if the mutant ORF replicate consistency is greater than the wild-type replicate consistency, and negative if the mutant ORF replicate consistency is less than the wild-type ORF replicate consistency. The line connecting each point and the graph origin is drawn to emphasize that a longer distance from the origin implies more confidence in the prediction. (B) Enrichment of impactful variants in genes found to be significantly mutated in cancer genome studies. GOF, COF, and LOF predictions are all considered impactful. ***p < 0.0001 by Fisher’s exact test. (C) Distribution of eVIP calls in known oncogenes, known tumor suppressor genes (TSGs), or genes of unknown function. (D–F) Gene-specific sparkler plots for known oncogenes (D), known tumor suppressor genes (E), and genes of unknown function (F). The tested variant allele is labeled and colored based on the eVIP prediction. Coloring is as in (A). See also Tables S2–S4, Data S1, and Data S2.

Citation

Alice H. Berger, Angela N. Brooks, Xiaoyun Wu, Yashaswi Shrestha, Candace Chouinard, Federica Piccioni, Mukta Bagul, Atanas Kamburov, Marcin Imielinski, Larson Hogstrom, Cong Zhu, Xiaoping Yang, Sasha Pantel, Ryo Sakai, Jacqueline Watson, Nathan Kaplan, Joshua D. Campbell, Shantanu Singh, David E. Root, Rajiv Narayan, Ted Natoli, David L. Lahr, Itay Tirosh, Pablo Tamayo, Gad Getz, Bang Wong, John Doench, Aravind Subramanian, Todd R. Golub, Matthew Meyerson, Jesse S. Boehm. High-throughput Phenotyping of Lung Cancer Somatic Mutations. Cancer Cell 30, 214-228 (2016). https://doi.org/10.1016/j.ccell.2016.06.022

Back to the plate

Figure 1 from Cell Painting, a high-content image-based assay for morphological profiling using multiplexed fluorescent dyes
Figure 1.

2016, Nature Protocols. Well A9.

Cell Painting, a high-content image-based assay for morphological profiling using multiplexed fluorescent dyes

Mark-Anthony Bray, Shantanu Singh, Han Han, Chadwick T Davis, Blake Borgeson, Cathy Hartland, Maria Kost-Alimova, Sigrun M Gustafsdottir, Christopher C Gibson, Anne E Carpenter

Read the paper

Caption

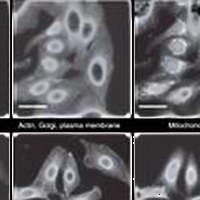
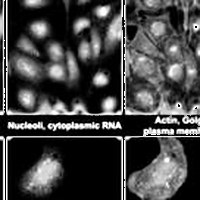
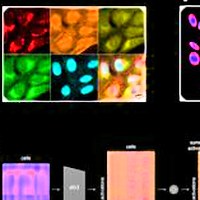
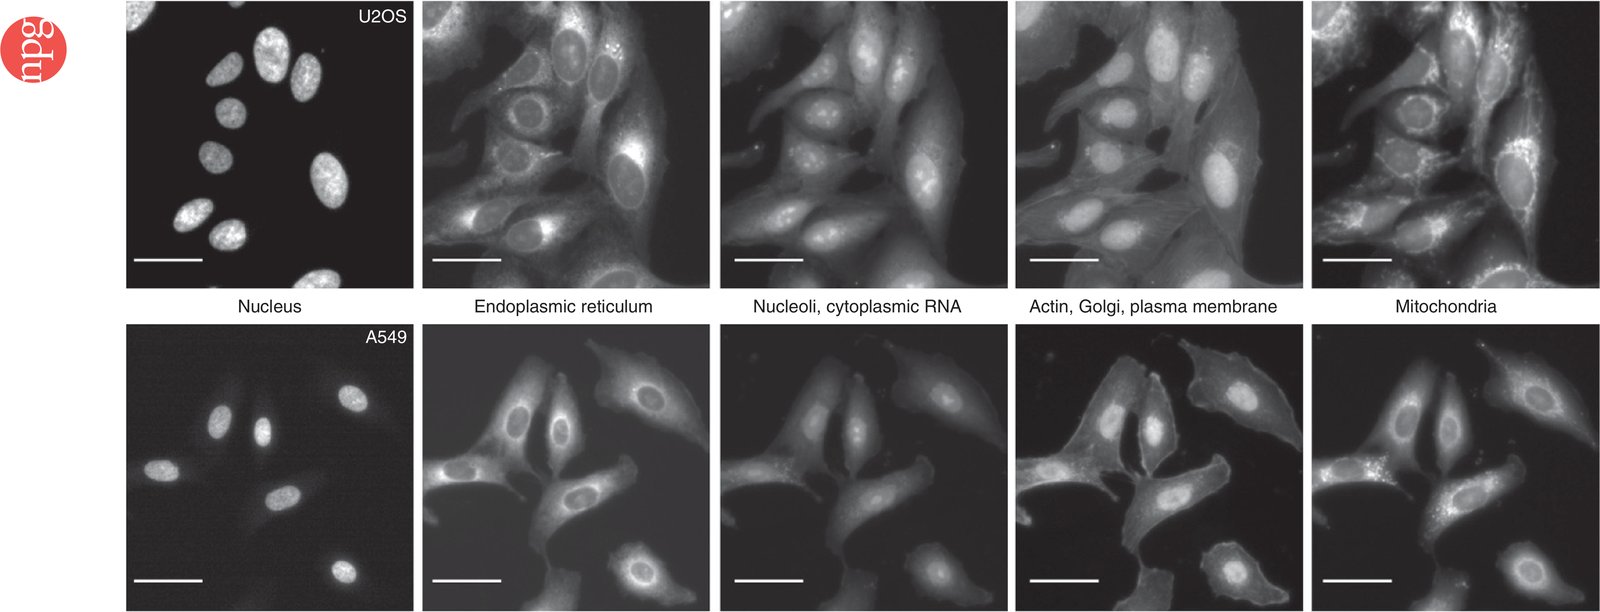
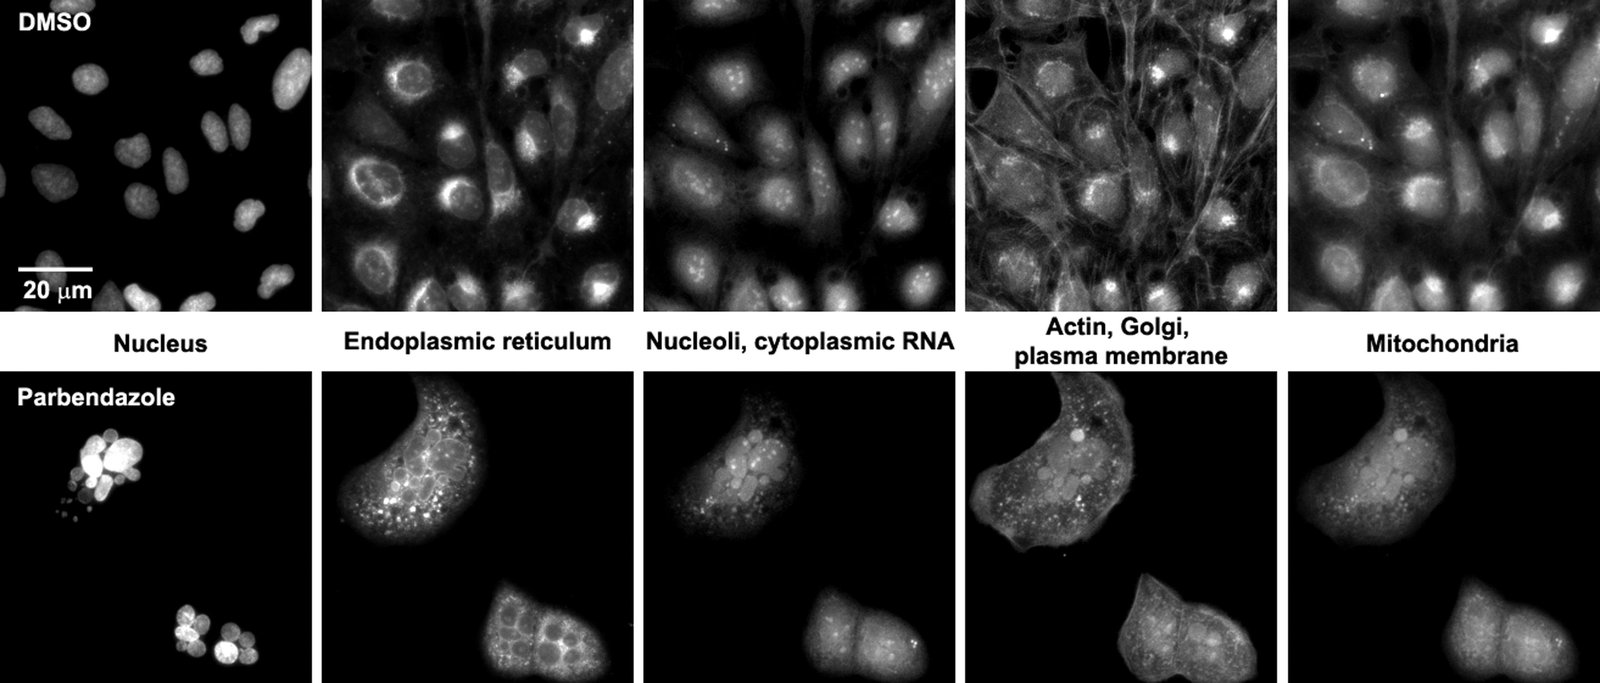
The Cell Painting assay in U2OS and A549 cells. The columns display the five channels imaged in the Cell Painting assay protocol (left to right) as imaged using the ImageXpress XLS microscope: Hoechst 33342 (DNA), concanavalin A (endoplasmic reticulum), SYTO 14 (nucleoli and cytoplasmic RNA), phalloidin (actin) and WGA (Golgi and plasma membrane), and MitoTracker Deep Red (mitochondria). Scale bars, 20 µm. See Table 1 for additional details about the stains and channels imaged.

Citation

Mark-Anthony Bray, Shantanu Singh, Han Han, Chadwick T. Davis, Blake Borgeson, Cathy Hartland, Maria Kost-Alimova, Sigrun M. Gustafsdottir, Christopher C. Gibson, Anne E. Carpenter. Cell Painting, a high-content image-based assay for morphological profiling using multiplexed fluorescent dyes. Nature Protocols 11, 1757-1774 (2016). https://doi.org/10.1038/nprot.2016.105

Back to the plate

Figure 1 from Automating Morphological Profiling with Generic Deep Convolutional Networks
Figure 1.

2016, bioRxiv. Well A10.

Automating Morphological Profiling with Generic Deep Convolutional Networks

Nick Pawlowski, Juan C Caicedo, Shantanu Singh, Anne E Carpenter, Amos Storkey

Read the paper

Caption

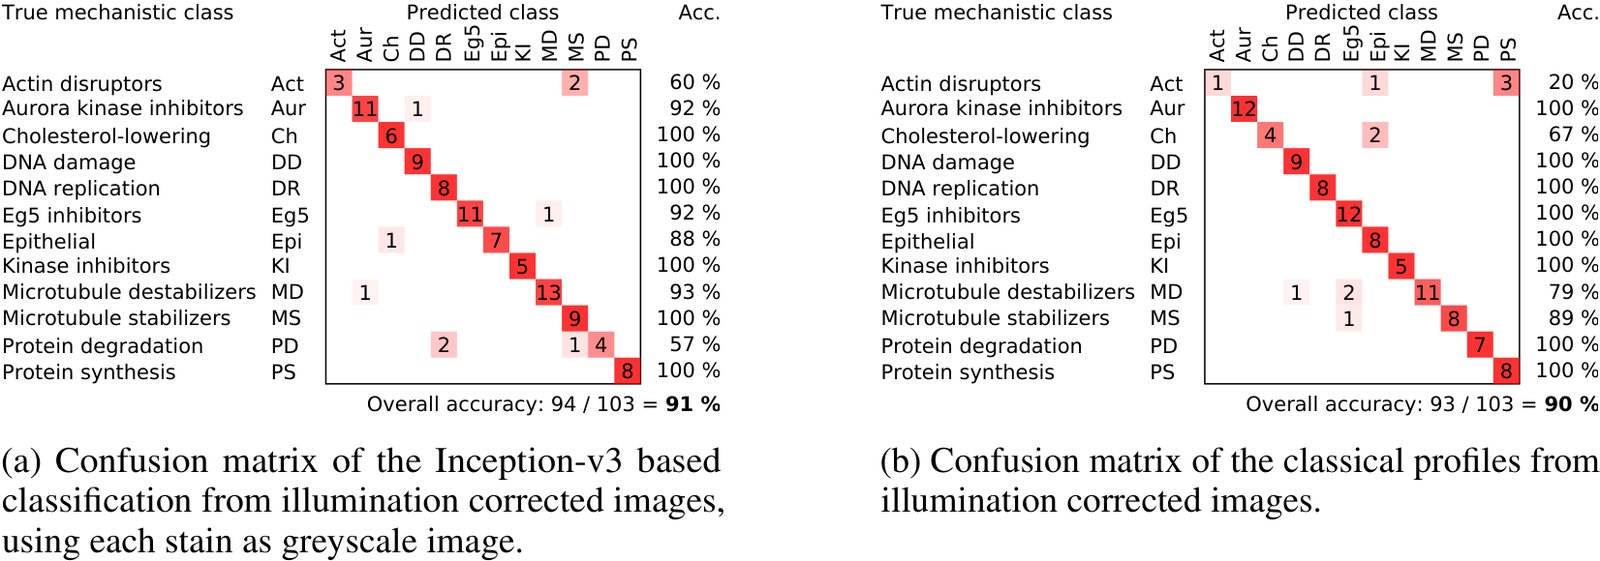
Comparison of the confusion matrices of the profiles generated using classical methods and from pretrained neural networks. The classical results were taken from Singh et al. [13]. The deep learning results were generated using the Inception-v3 architecture. Each stain was transformed as a separate greyscale image.

Citation

Nick Pawlowski, Juan C. Caicedo, Shantanu Singh, Anne E. Carpenter, Amos Storkey. Automating Morphological Profiling with Generic Deep Convolutional Networks. bioRxiv (2016). https://doi.org/10.1101/085118

Back to the plate

2017

Figure 1 from A dataset of images and morphological profiles of 30 000 small-molecule treatments using the Cell Painting assay
Figure 1.

2017, GigaScience. Well A11.

A dataset of images and morphological profiles of 30 000 small-molecule treatments using the Cell Painting assay

Mark-Anthony Bray, Sigrun M Gustafsdottir, Mohammad H Rohban, Shantanu Singh, Vebjorn Ljosa, Katherine L Sokolnicki, Joshua A Bittker, Nicole E Bodycombe, Vlado Dančík, Thomas P Hasaka, Cindy S Hon, Melissa M Kemp, Kejie Li, Deepika Walpita, Mathias J Wawer, Todd R Golub, Stuart L Schreiber, Paul A Clemons, Alykhan F Shamji, Anne E Carpenter

Read the paper

Caption

Sample images of U2OS cells from the small-molecule Cell Painting experiment. Images are shown from a DMSO well (negative control, top row) and a parbendazole well (bottom row). The columns display the 5 channels imaged in the Cell Painting assay protocol (see Table 1 for details about the stains and channels imaged).

Citation

Mark-Anthony Bray, Sigrun M. Gustafsdottir, Mohammad H. Rohban, Shantanu Singh, Vebjorn Ljosa, Katherine L. Sokolnicki, Joshua A. Bittker, Nicole E. Bodycombe, Vlado Dančík, Thomas P. Hasaka, Cindy S. Hon, Melissa M. Kemp, Kejie Li, Deepika Walpita, Mathias J. Wawer, Todd R. Golub, Stuart L. Schreiber, Paul A. Clemons, Alykhan F. Shamji, Anne E. Carpenter. A dataset of images and morphological profiles of 30 000 small-molecule treatments using the Cell Painting assay. GigaScience 6, giw014 (2017). https://doi.org/10.1093/gigascience/giw014

Back to the plate

Figure 3 from Systematic morphological profiling of human gene and allele function via Cell Painting
Figure 3.

2017, eLife. Well A12.

Systematic morphological profiling of human gene and allele function via Cell Painting

Mohammad Hossein Rohban, Shantanu Singh, Xiaoyun Wu, Julia B Berthet, Mark-Anthony Bray, Yashaswi Shrestha, Xaralabos Varelas, Jesse S Boehm, Anne E Carpenter

Read the paper

Caption

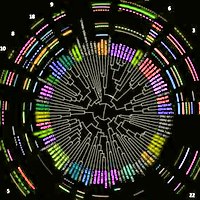
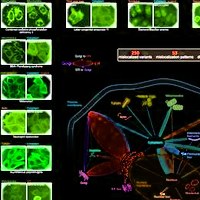
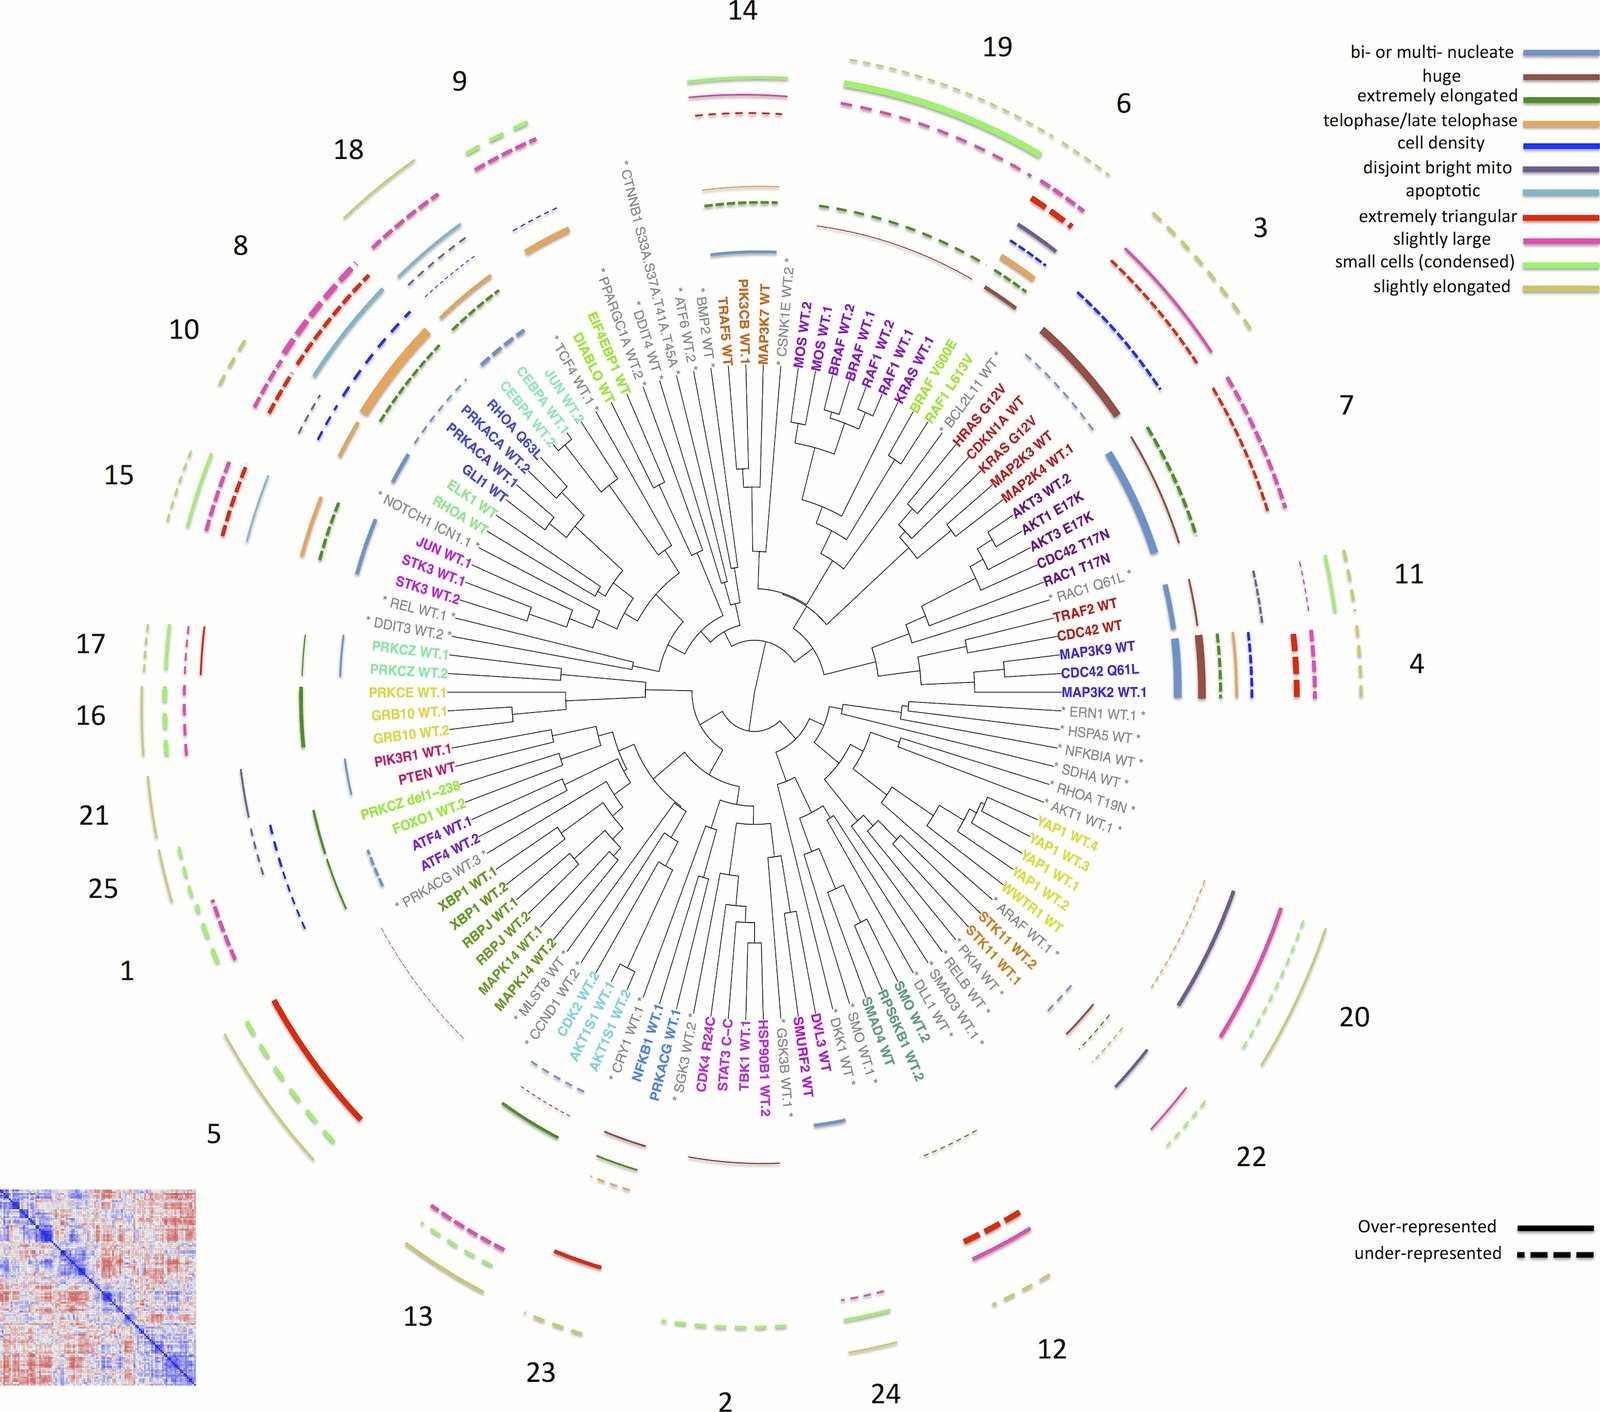
Morphological relationships among overexpressed genes/alleles, determined by Cell Painting. Correlations between pairs of genes/alleles were calculated and displayed in a correlation matrix (bottom left inset, full resolution is available as Figure 3—figure supplement 1). Only the 110 genes/alleles with a detectable morphological phenotype were included. The rows and columns are ordered based on a hierarchical clustering algorithm such that each blue submatrix on the diagonal shows a cluster of genes resulting in similar phenotypes. The correlations were then used to create a dendrogram (main panel) where the radius of the subtree containing a cluster shows the strength of correlation. The 25 clusters containing at least two constructs are printed on the dendrogram in arbitrary colored fonts, while gene names colored gray and marked by asterisks are those that do not correlate as strongly with their nearest neighbors (i.e., they are singletons or fall below the threshold used to cut the dendrogram for clustering). Each colored arc corresponds to a cell subpopulation as noted in the legend. Line thickness indicates the strength of enrichment of the subpopulation in the cluster samples compared to the negative control. Solid vs. dashed lines indicate the over- vs. under-representation of the corresponding subpopulation in a cluster, respectively. Note that the number next to each cluster in the dendrogram is referenced in the main text and corresponds to the numbered supplemental data file for each cluster.

Citation

Mohammad Hossein Rohban, Shantanu Singh, Xiaoyun Wu, Julia B. Berthet, Mark-Anthony Bray, Yashaswi Shrestha, Xaralabos Varelas, Jesse S. Boehm, Anne E. Carpenter. Systematic morphological profiling of human gene and allele function via Cell Painting. eLife 6, e24060 (2017). https://doi.org/10.7554/eLife.24060

Back to the plate

Figure 1 from TopoWellPlate: A Well‐Plate‐Based Screening Platform to Study Cell–Surface Topography Interactions
Figure 1.

2017, Advanced Biosystems. Well B1.

TopoWellPlate: A Well‐Plate‐Based Screening Platform to Study Cell–Surface Topography Interactions

Nick R. M. Beijer, Aliaksei S. Vasilevich, Bayram Pilavci, Roman K. Truckenmüller, Yiping Zhao, Shantanu Singh, Bernke J. Papenburg, Jan de Boer

Read the paper

Caption

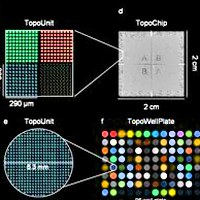
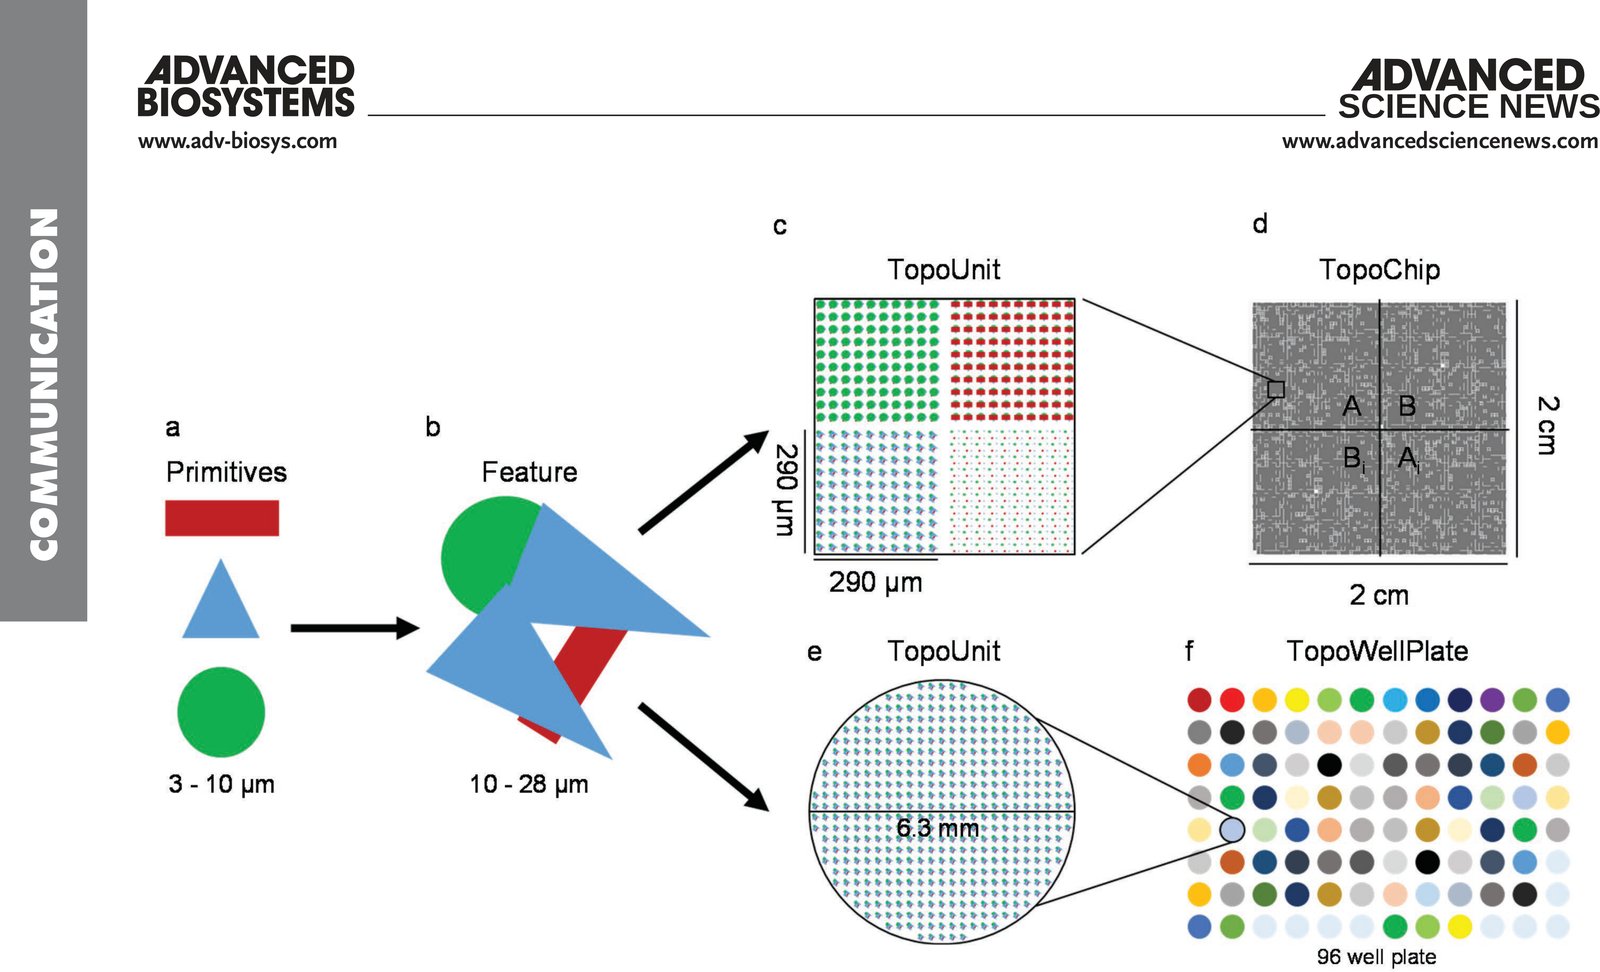
TopoWellPlate as a new member of the TopoChip platform. a) Primitive shapes (namely, circles, triangles, and rectangles) are used to design b) topographical features. Arrays of a unique topographical feature build c) a 290 × 290 µm square TopoUnit for d) the TopoChip and e) an isolated circular TopoUnit of 6.3 mm in diameter for f) the TopoWellPlate. The TopoChip contains 2176 unique surface topographies in duplicate and 4 unpatterned units, whereas the TopoWellPlate contains 87 unique surface topographies and 9 unpatterned wells.

Citation

Nick R. M. Beijer, Aliaksei S. Vasilevich, Bayram Pilavci, Roman K. Truckenmüller, Yiping Zhao, Shantanu Singh, Bernke J. Papenburg, Jan de Boer. TopoWellPlate: A Well-Plate-Based Screening Platform to Study Cell-Surface Topography Interactions. Advanced Biosystems 1, 1700002 (2017). https://doi.org/10.1002/adbi.201700002

Back to the plate

Figure 2 from Systematic, multiparametric analysis of Mycobacterium tuberculosis intracellular infection offers insight into coordinated virulence
Figure 2.

2017, PLOS Pathogens. Well B2.

Systematic, multiparametric analysis of Mycobacterium tuberculosis intracellular infection offers insight into coordinated virulence

Amy K. Barczak, Roi Avraham, Shantanu Singh, Samantha S. Luo, Wei Ran Zhang, Mark-Anthony Bray, Amelia E. Hinman, Matthew Thompson, Raymond M. Nietupski, Aaron Golas, Paul Montgomery, Michael Fitzgerald, Roger S. Smith, Dylan W. White, Anna D. Tischler, Anne E. Carpenter, Deborah T. Hung

Read the paper

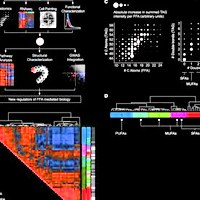
Caption

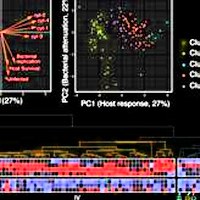
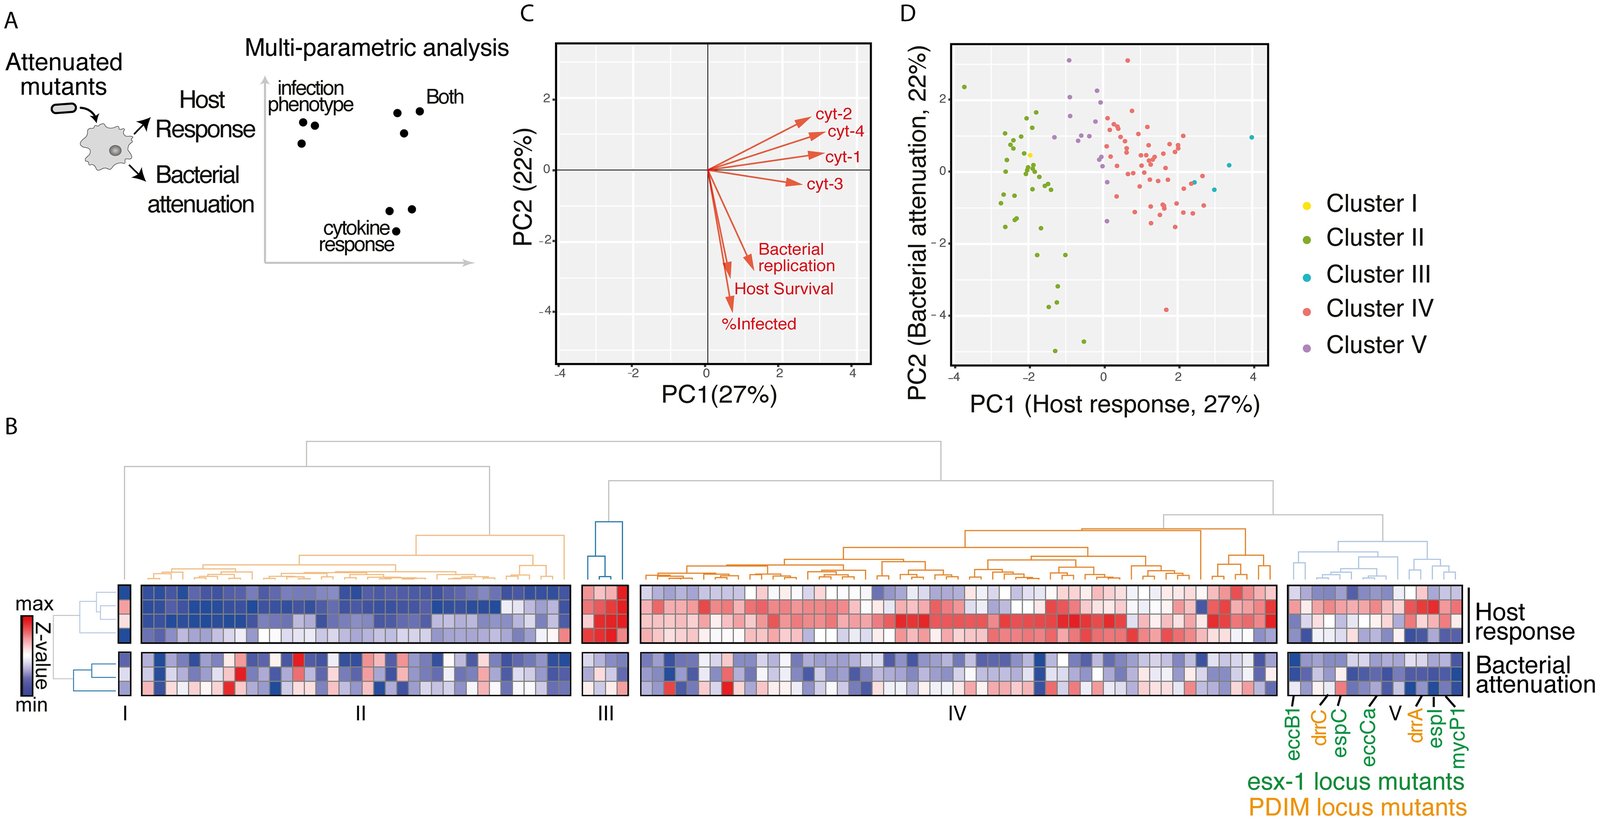
Multiparametric analysis of mutants impaired for intracellular growth identified subsets with shared complex phenotypes. (A) Schematic diagram of the approach to analyzing the mutants. Bacterial attenuation was analyzed based on three imaging parameters (Mtb fluorescence intensity, percent infected, and macrophage count) and host response was analyzed based on multiplexed cytokine analysis for each mutant. The phenotypes for each mutant were then combined into a multiparametric analysis as described in B. (B) Unsupervised 2-D clustering of mutants based on a multiparametric representation of their phenotypes. This analysis combines the four host response clusters (top 4 rows) and three bacterial imaging clusters (bottom 3 rows). Each column represents one of the 113 mutants included in the analysis. Colors indicate low (blue) to high (red) normalized values for each phenotype. Mutants cluster into five groups (Clusters I-V). Mutants in the PDIM locus (labels in orange) and ESX-1 locus (labels in green) group together in Cluster V. (C) Contribution of each bacterial imaging phenotype (bacterial replication, host survival, and % infected: orange vectors) and clustered cytokine response phenotype (cyt-1, cyt-2, cyt-3, and cyt-4: black vectors) to principal component 1 (PC1) and principal component 2 (PC2) of the principal component analysis. PC1 is comprised almost entirely of cytokine phenotypes while PC2 is comprised almost entirely of bacterial imaging features, suggesting that the two sets of features represent orthogonal and complementary information. (D) The 113 mutants included in the multiparametric analysis separate when plotted by PC1 and PC2. Included mutants were those that induced macrophage responses most distinct from the response to wild-type Mtb. Coloring of mutant clusters reflects mapping of the analysis performed in 2D back to the PC1/PC2 graph.

Citation

Amy K. Barczak, Roi Avraham, Shantanu Singh, Samantha S. Luo, Wei Ran Zhang, Mark-Anthony Bray, Amelia E. Hinman, Matthew Thompson, Raymond M. Nietupski, Aaron Golas, Paul Montgomery, Michael Fitzgerald, Roger S. Smith, Dylan W. White, Anna D. Tischler, Anne E. Carpenter, Deborah T. Hung. Systematic, multiparametric analysis of Mycobacterium tuberculosis intracellular infection offers insight into coordinated virulence. PLOS Pathogens 13, 1006363 (2017). https://doi.org/10.1371/journal.ppat.1006363

Back to the plate

Figure 7 from Mining for osteogenic surface topographies: In silico design to in vivo osseo-integration
Figure 7.

2017, Biomaterials. Well B3.

Mining for osteogenic surface topographies: In silico design to in vivo osseo-integration

Frits F.B. Hulshof, Bernke Papenburg, Aliaksei Vasilevich, Marc Hulsman, Yiping Zhao, Marloes Levers, Natalie Fekete, Meint de Boer, Huipin Yuan, Shantanu Singh, Nick Beijer, Mark-Anthony Bray, David J. Logan, Marcel Reinders, Anne E. Carpenter, Clemens van Blitterswijk, Dimitrios Stamatialis, Jan de Boer

Read the paper

Caption

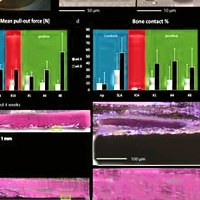
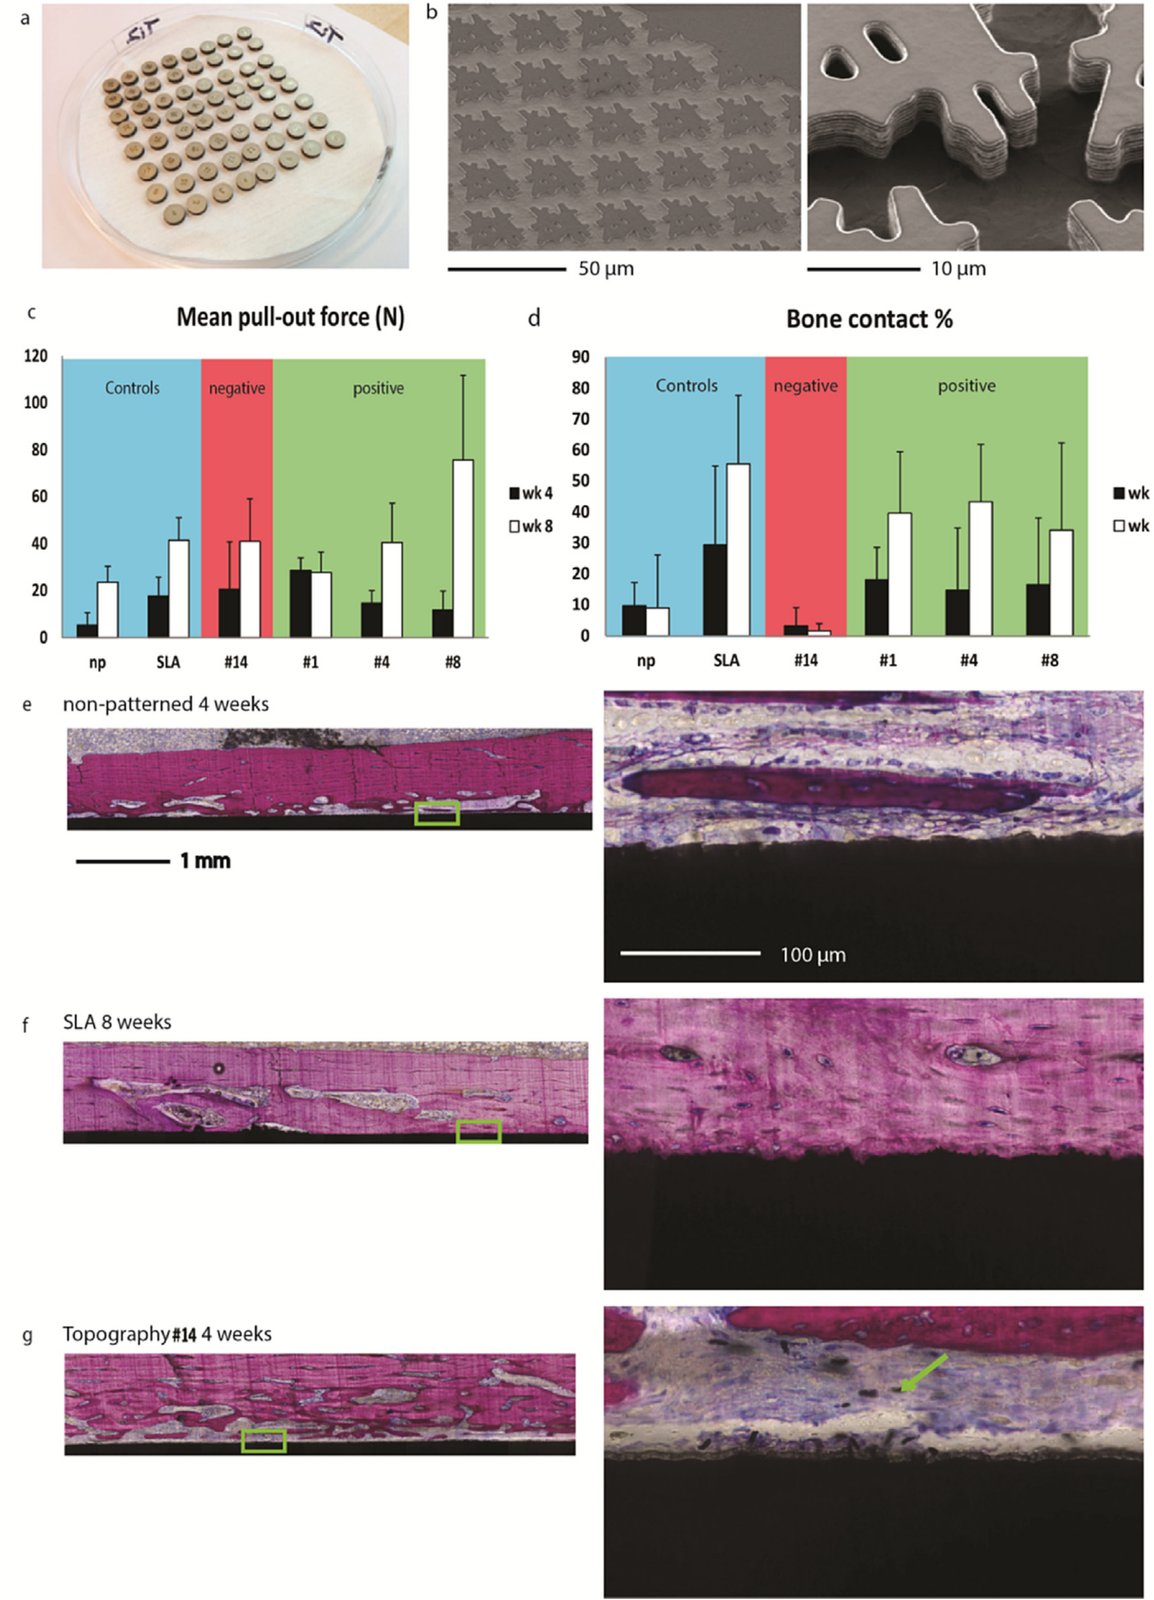
In vitro characterized osteogenic surface topography shows increased bone bonding in vivo. (a) Solid titanium discs were enhanced with the hit topography surface structures for in vivo implantation. (b) SEM images of a hit topography micro-machined in a solid titanium disc. Two magnifications show the reproducibility of the topographical features as well as the topographical feature shape quality. (c,d) Mean pull-out force and bone contact percentage of the topography enhanced titanium discs from rabbit femurs 4 (black bars) and 8 weeks (white bars) after implantation. The blue shaded region of the graphs include the non-patterned reference and the clinical sand blasted, acid etched benchmark, red the topography identified as non-osteogenic, and green the topographies identified as osteogenic. Error bars represent the standard deviation. Typical histology images of a bone slice with (e) a non-patterned substrate after 4 weeks of implantation, (f) a SLA substrate after 8 weeks of implantation and (g) a low ALP hit topography #14 substrate after 4 weeks of implantation. Note: yellow arrow indicates titanium particles in the tissue. (left) An overview of entire width of the implant. (right) A magnified area from the implant, indicated with a white box in the left image. Methylene blue and basic fuchsin staining to visualize the cells and expression of an osteogenic marker and in black the titanium substrates. Representative images of bone slices from the other topographies (#1, #4 and #8) are shown in Supplementary Fig. S6.

Citation

Frits F. B. Hulshof, Bernke Papenburg, Aliaksei Vasilevich, Marc Hulsman, Yiping Zhao, Marloes Levers, Natalie Fekete, Meint de Boer, Huipin Yuan, Shantanu Singh, Nick Beijer, Mark-Anthony Bray, David J. Logan, Marcel Reinders, Anne E. Carpenter, Clemens van Blitterswijk, Dimitrios Stamatialis, Jan de Boer. Mining for osteogenic surface topographies: In silico design to in vivo osseo-integration. Biomaterials 137, 49-60 (2017). https://doi.org/10.1016/j.biomaterials.2017.05.020

Back to the plate

Figure I from How Not To Drown in Data: A Guide for Biomaterial Engineers
Figure I.

2017, Trends in Biotechnology. Well B4.

How Not To Drown in Data: A Guide for Biomaterial Engineers

Aliaksei S. Vasilevich, Aurélie Carlier, Jan de Boer, Shantanu Singh

Read the paper

Caption

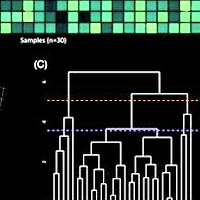
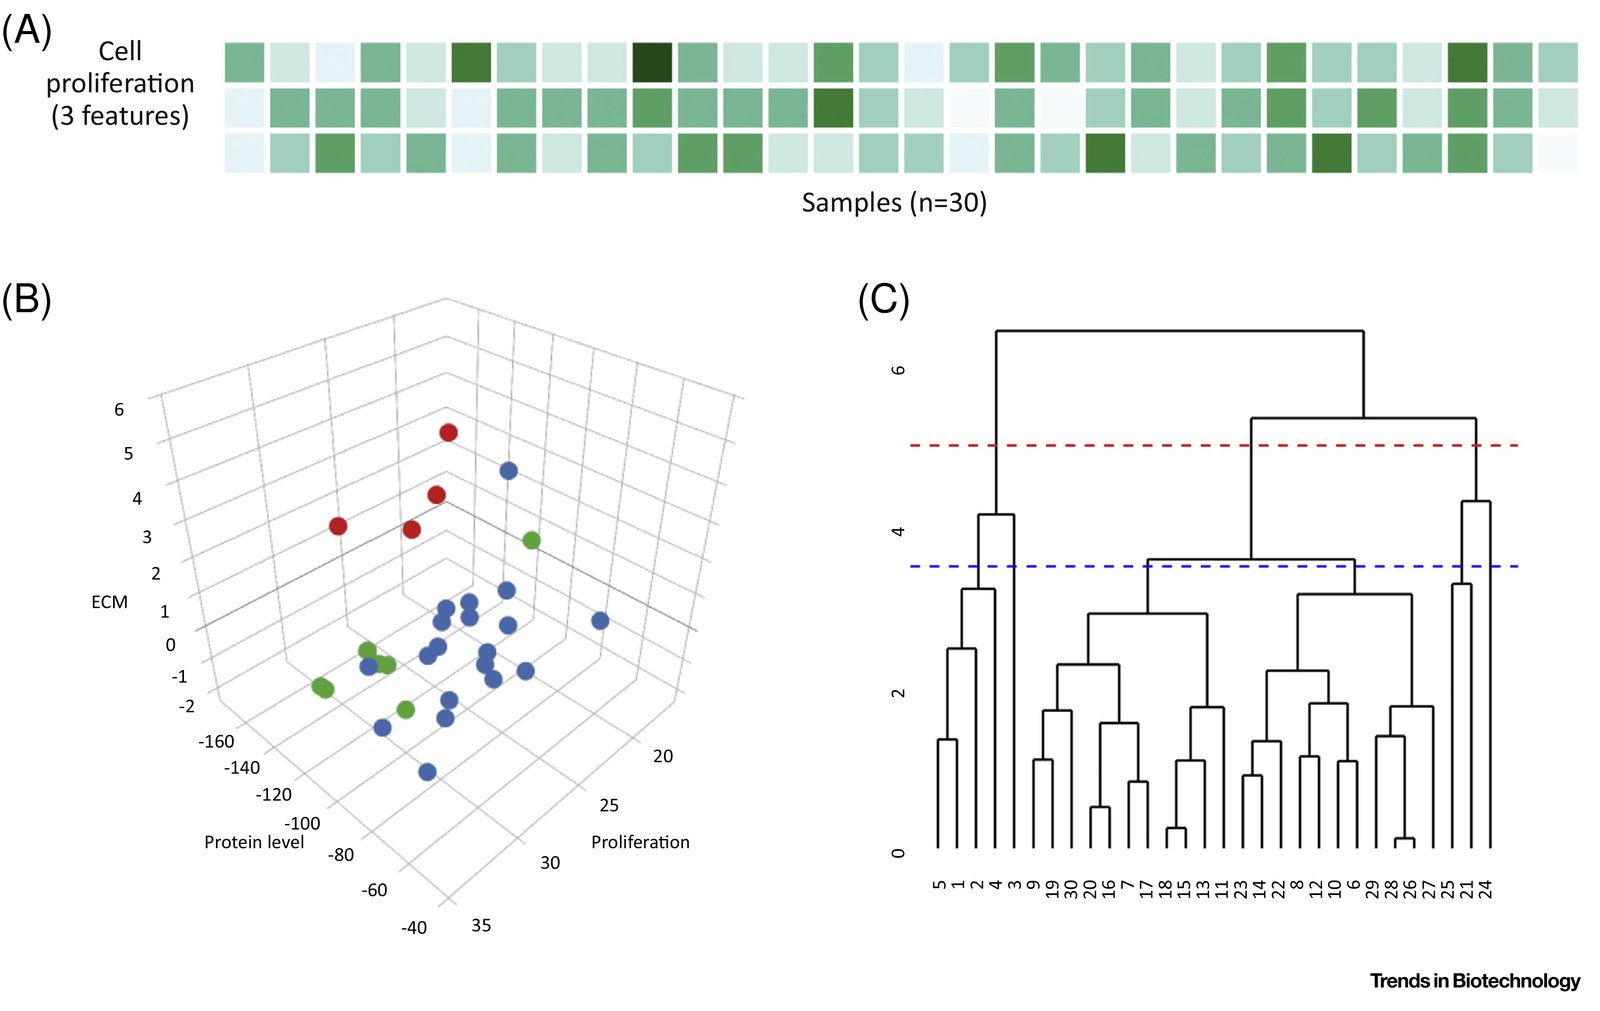
Clustering. (A) Cell response feature matrix. (B) k-Means clustering is performed to cluster the cell response features into k = 3 clusters, each of which can be considered as a phenotypic group. Each column of the feature matrix is plotted as a point. Colors indicate cluster assignments calculated using k-means. (C) Hierarchical clustering clusters the 30 datapoints into a ‘dendrogram’. The sample number of each biomaterial is shown on the x axis. The dendrogram or ‘tree’ can be cut at any height to partition the data into clusters. Cutting it at a height of 5 (red broken line) results in two clusters and a height of 3.5 (blue broken line) results in four clusters. Abbreviation: ECM, extracellular matrix.

Citation

Aliaksei S. Vasilevich, Aurélie Carlier, Jan de Boer, Shantanu Singh. How Not To Drown in Data: A Guide for Biomaterial Engineers. Trends in Biotechnology 35, 743-755 (2017). https://doi.org/10.1016/j.tibtech.2017.05.007

Back to the plate

Figure 1 from Data-analysis strategies for image-based cell profiling
Figure 1.

2017, Nature Methods. Well B5.

Data-analysis strategies for image-based cell profiling

Juan C Caicedo, Sam Cooper, Florian Heigwer, Scott Warchal, Peng Qiu, Csaba Molnar, Aliaksei S Vasilevich, Joseph D Barry, Harmanjit Singh Bansal, Oren Kraus, Mathias Wawer, Lassi Paavolainen, Markus D Herrmann, Mohammad Rohban, Jane Hung, Holger Hennig, John Concannon, Ian Smith, Paul A Clemons, Shantanu Singh, Paul Rees, Peter Horvath, Roger G Linington, Anne E Carpenter

Read the paper

Caption

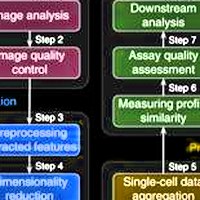
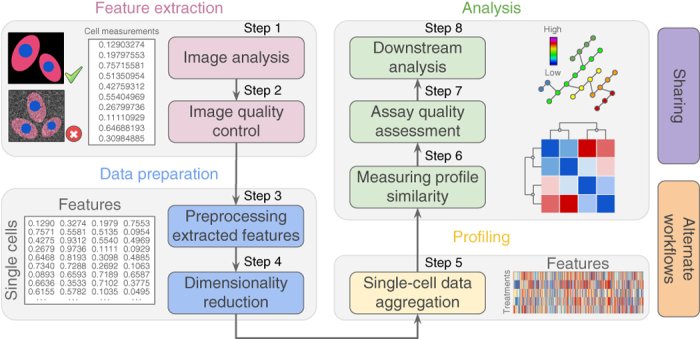
Representative workflow for image-based cell profiling. Eight main steps transform images into quantitative information to support experimental conclusions.

Citation

Juan C. Caicedo, Sam Cooper, Florian Heigwer, Scott Warchal, Peng Qiu, Csaba Molnar, Aliaksei S. Vasilevich, Joseph D. Barry, Harmanjit Singh Bansal, Oren Kraus, Mathias Wawer, Lassi Paavolainen, Markus D. Herrmann, Mohammad Rohban, Jane Hung, Holger Hennig, John Concannon, Ian Smith, Paul A. Clemons, Shantanu Singh, Paul Rees, Peter Horvath, Roger G. Linington, Anne E. Carpenter. Data-analysis strategies for image-based cell profiling. Nature Methods 14, 849-863 (2017). https://doi.org/10.1038/nmeth.4397

Back to the plate

Figure 2 from CytoGAN: Generative Modeling of Cell Images
Figure 2.

2017, bioRxiv. Well B6.

CytoGAN: Generative Modeling of Cell Images

Peter Goldsborough, Nick Pawlowski, Juan C Caicedo, Shantanu Singh, Anne E Carpenter

Read the paper

Caption

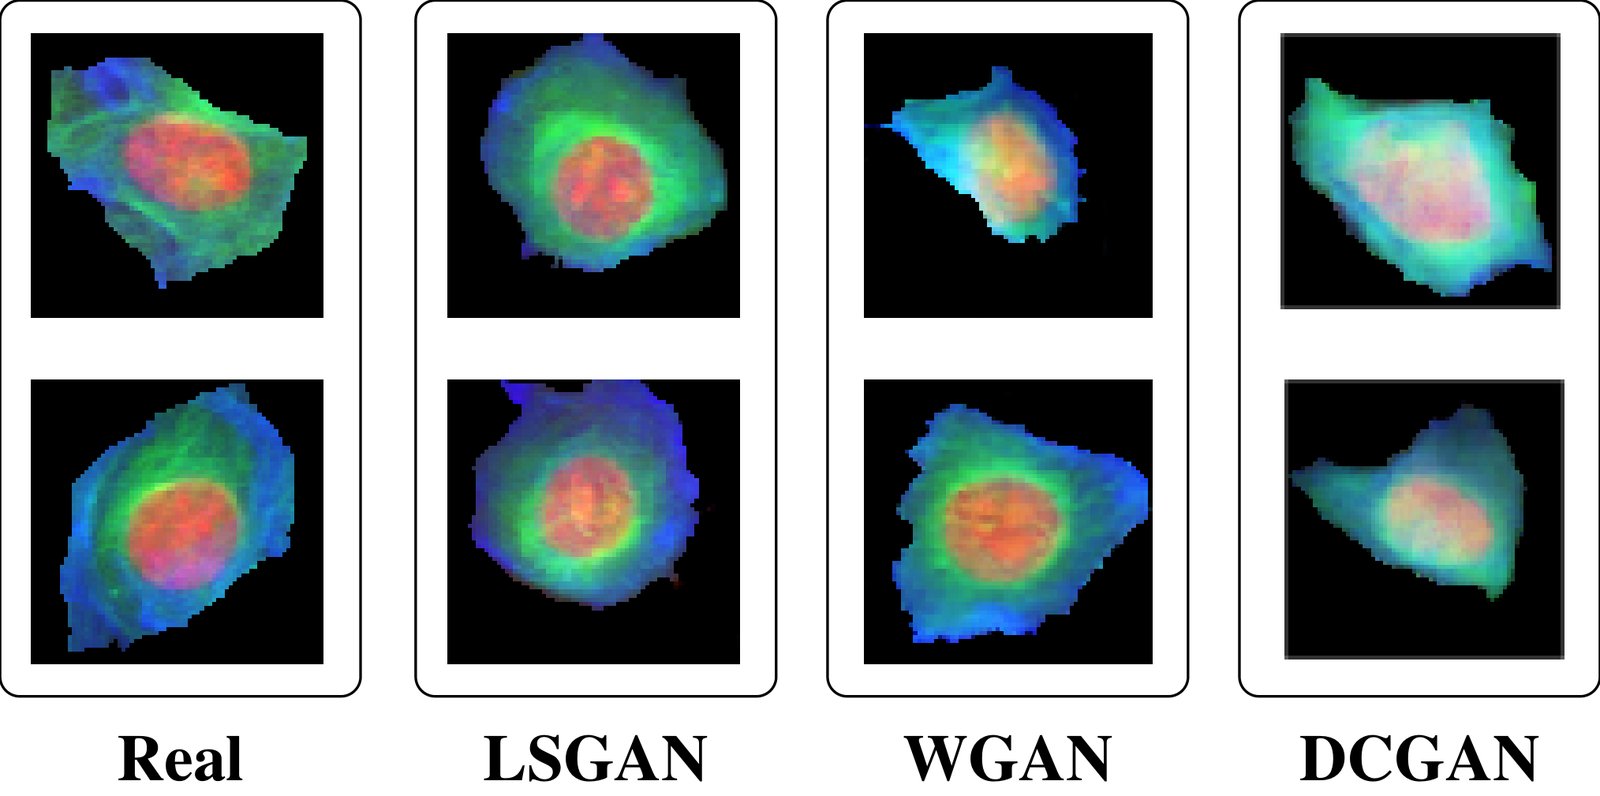
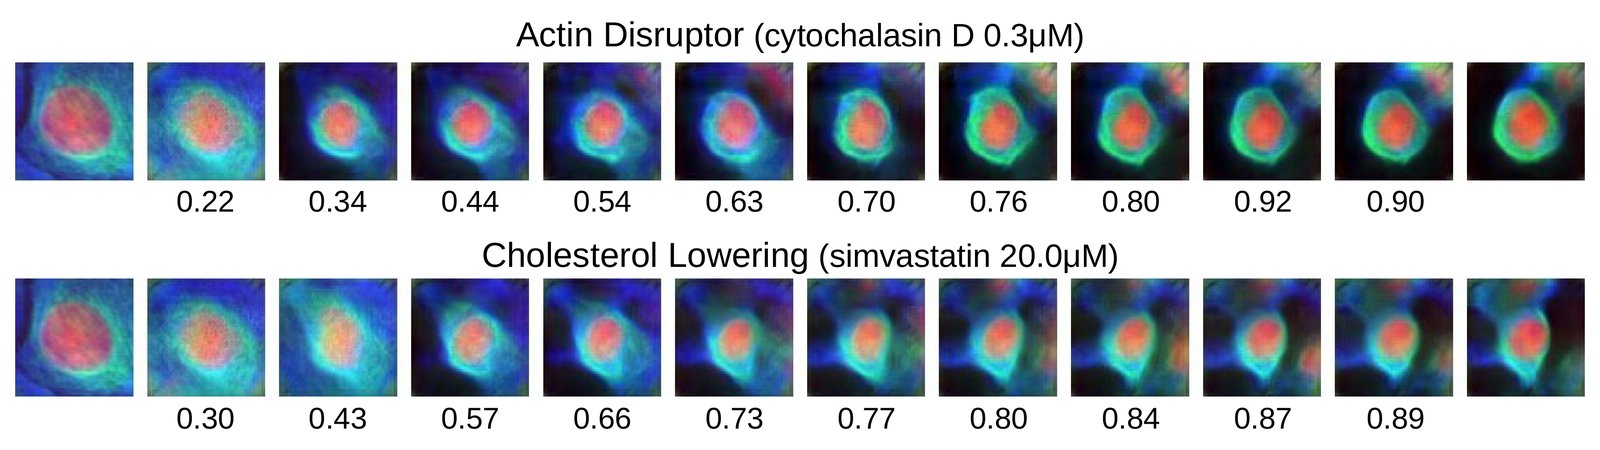
Examples of real BBBC021 cell images juxtaposed with synthetic cell images generated with LSGAN, WGAN and DCGAN.

Citation

Peter Goldsborough, Nick Pawlowski, Juan C. Caicedo, Shantanu Singh, Anne E. Carpenter. CytoGAN: Generative Modeling of Cell Images. bioRxiv (2017). https://doi.org/10.1101/227645

Back to the plate

2018

Figure 2 from Combining morphological and migration profiles of in vitro time-lapse data
Figure 2.

2018, IEEE International Symposium on Biomedical Imaging (ISBI 2018). Well B7.

Combining morphological and migration profiles of in vitro time-lapse data

Tim Becker, Juan C. Caicedo, Shantanu Singh, Markus Weckmann, Anne E. Carpenter

Read the paper

Caption

The migration profiles of all experimental groups is shown as a 360 degree histogram of the trajectories distribution. Additionally, the speed distribution in each sector is color coded similar to a windrose plot. A directed migration is represented by a dominant migration towards the chemoattractant Interleukin-8 on the left. The strongest effect of the Prednisolone treatment can be observed in Fibronectin (FN) as opposed to a collagen-rich matrix (HEM).

Citation

Tim Becker, Juan C. Caicedo, Shantanu Singh, Markus Weckmann, Anne E. Carpenter. Combining morphological and migration profiles of in vitro time-lapse data. IEEE International Symposium on Biomedical Imaging (ISBI 2018), 965-968 (2018). https://doi.org/10.1109/ISBI.2018.8363731

Back to the plate

Figure 2 from Repurposing High-Throughput Image Assays Enables Biological Activity Prediction for Drug Discovery
Figure 2.

2018, Cell Chemical Biology. Well B8.

Repurposing High-Throughput Image Assays Enables Biological Activity Prediction for Drug Discovery

Jaak Simm, Günter Klambauer, Adam Arany, Marvin Steijaert, Jörg Kurt Wegner, Emmanuel Gustin, Vladimir Chupakhin, Yolanda T. Chong, Jorge Vialard, Peter Buijnsters, Ingrid Velter, Alexander Vapirev, Shantanu Singh, Anne E. Carpenter, Roel Wuyts, Sepp Hochreiter, Yves Moreau, Hugo Ceulemans

Read the paper

Caption

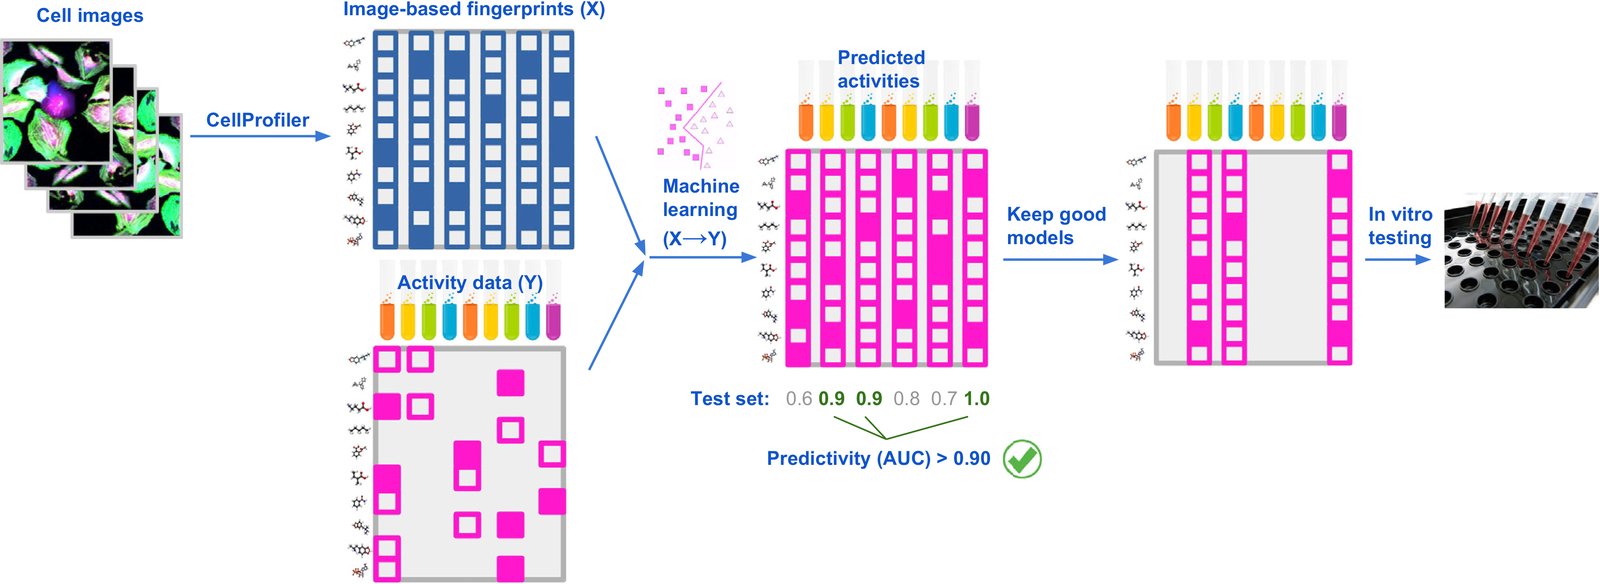
Strategy to Repurpose Imaging Screens to Efficiently Predict Biological Activity. Features extracted from images of cells are used by machine-learning methods to model all available activity data from previously performed assays. Assays with good predictivity on the test data are then selected for testing a relatively small number of predicted-active compounds, chosen from a large set of compounds profiled in the imaging assay.

Citation

Jaak Simm, Günter Klambauer, Adam Arany, Marvin Steijaert, Jörg Kurt Wegner, Emmanuel Gustin, Vladimir Chupakhin, Yolanda T. Chong, Jorge Vialard, Peter Buijnsters, Ingrid Velter, Alexander Vapirev, Shantanu Singh, Anne E. Carpenter, Roel Wuyts, Sepp Hochreiter, Yves Moreau, Hugo Ceulemans. Repurposing High-Throughput Image Assays Enables Biological Activity Prediction for Drug Discovery. Cell Chemical Biology 25, 611-618.e3 (2018). https://doi.org/10.1016/j.chembiol.2018.01.015

Back to the plate

Figure 6 from Weakly Supervised Learning of Single-Cell Feature Embeddings
Figure 6.

2018, IEEE/CVF Conference on Computer Vision and Pattern Recognition (CVPR 2018). Well B9.

Weakly Supervised Learning of Single-Cell Feature Embeddings

Juan C. Caicedo, Claire McQuin, Allen Goodman, Shantanu Singh, Anne E. Carpenter

Read the paper

Caption

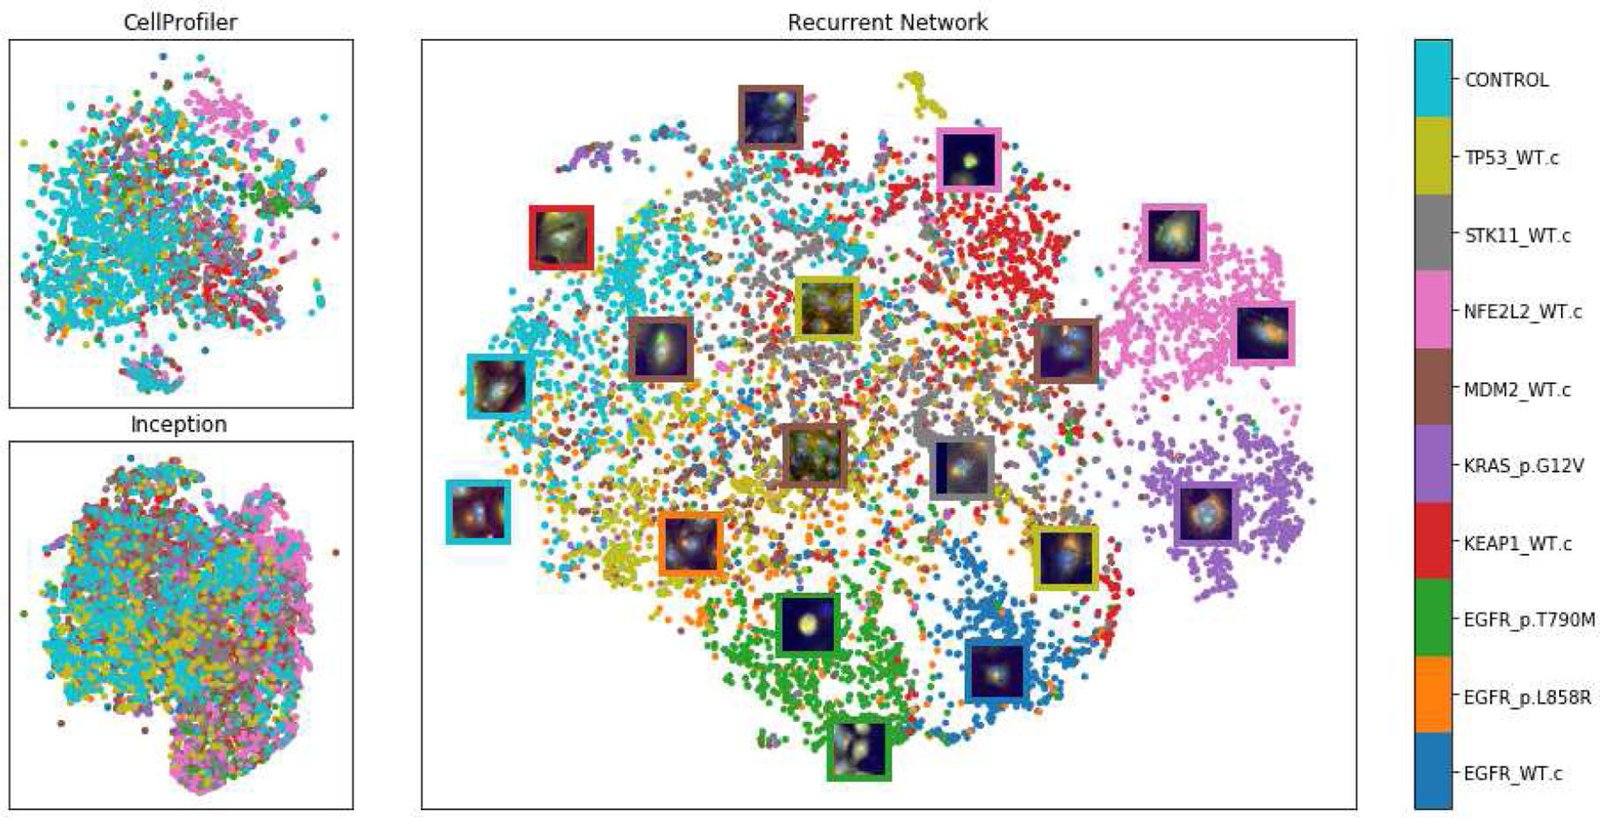
tSNE visualization of single-cell feature embeddings produced by three methods for a holdout set of the 10 training mutations. Top-left is based on classical features (with 300 dimensions). The bottom-left uses features extracted by an Inception network pretrained on ImageNet [29] (with 7,630 dimensions). The center plot shows the embeddings learned by our ResNet18 model supervised with the proposed recurrent network (256 dimensions). The colors in the plot correspond to the names of the genes used to trained the network in the auxiliary task.

Citation

Juan C. Caicedo, Claire McQuin, Allen Goodman, Shantanu Singh, Anne E. Carpenter. Weakly Supervised Learning of Single-Cell Feature Embeddings. IEEE/CVF Conference on Computer Vision and Pattern Recognition (CVPR 2018), 9309-9318 (2018). https://doi.org/10.1109/CVPR.2018.00970

Back to the plate

Figure 5 from Designed Surface Topographies Control ICAM-1 Expression in Tonsil-Derived Human Stromal Cells
Figure 5.

2018, Frontiers in Bioengineering and Biotechnology. Well B10.

Designed Surface Topographies Control ICAM-1 Expression in Tonsil-Derived Human Stromal Cells

Aliaksei S. Vasilevich, Frédéric Mourcin, Anouk Mentink, Frits Hulshof, Nick Beijer, Yiping Zhao, Marloes Levers, Bernke Papenburg, Shantanu Singh, Anne E. Carpenter, Dimitrios Stamatialis, Clemens van Blitterswijk, Karin Tarte, Jan de Boer

Read the paper

Caption

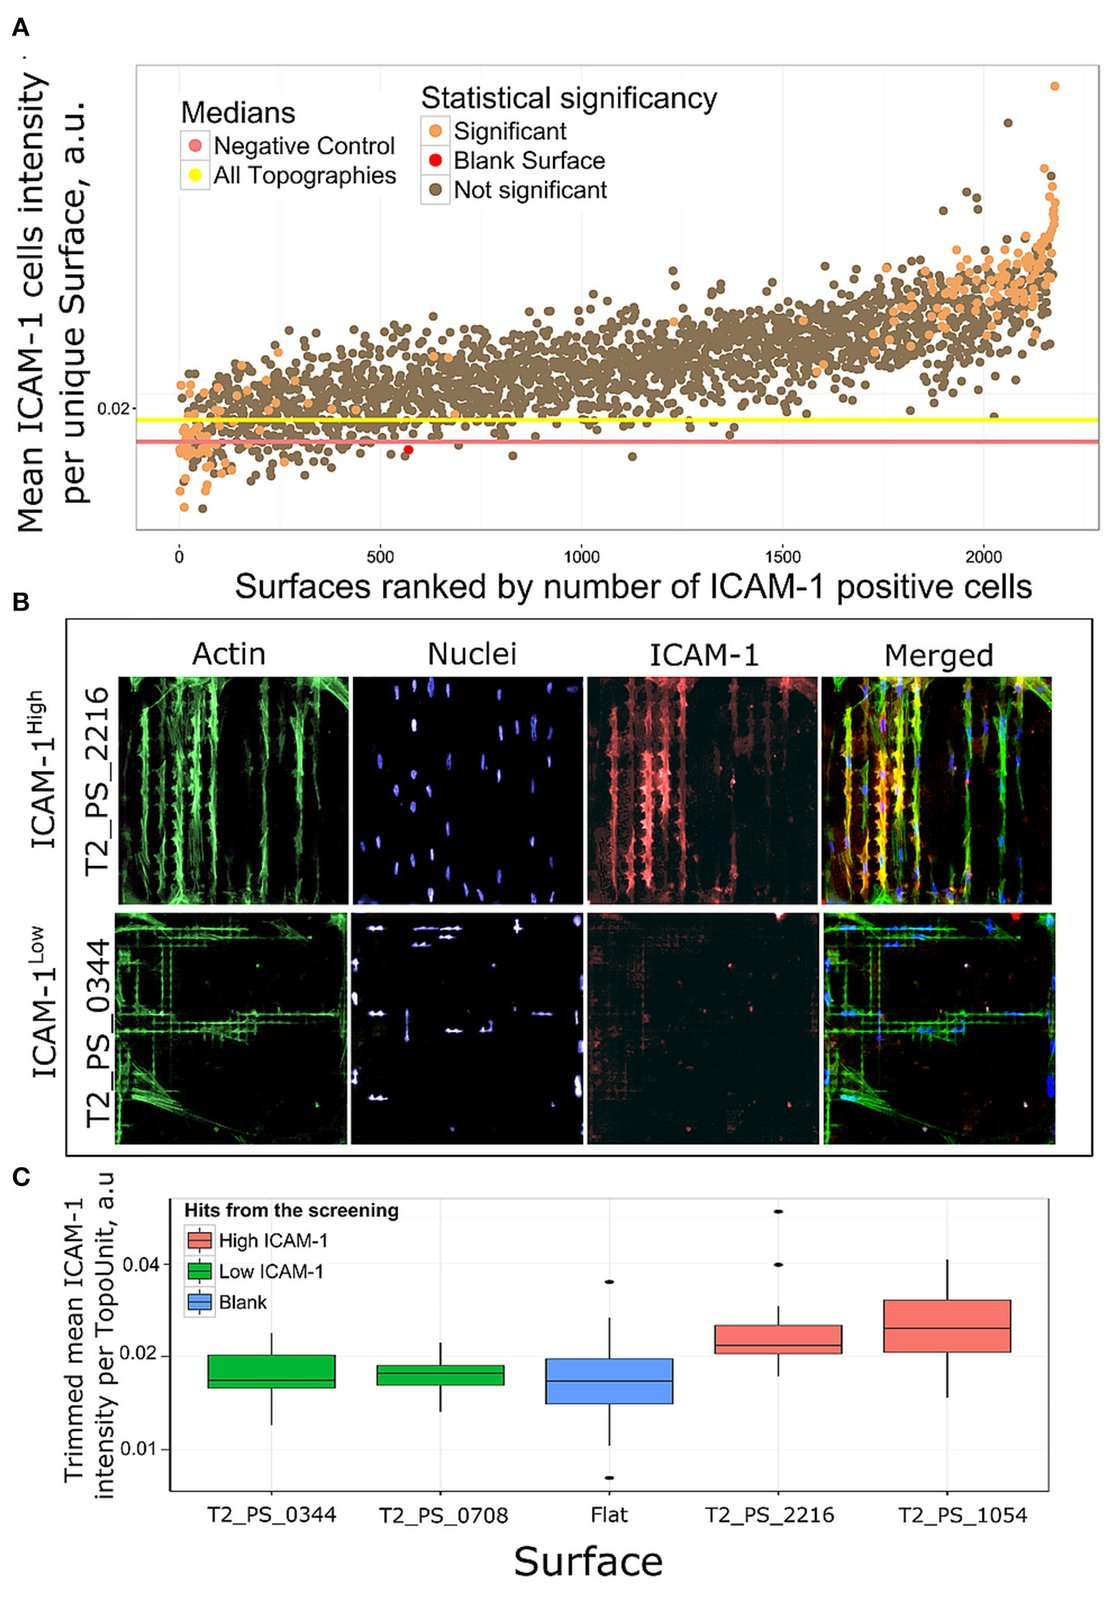
Rank of surfaces based on ICAM-1 intensity. (A) Mean ICAM-1 expression in all replicas was ranked by a number of ICAM-1 positive cells. Using chi-square test we identified 184 surfaces with significantly different number of ICAM-1 positive cells in comparison with flat polystyrene, orange dots. (B) Immunofluorescent images of cell morphologies represented by actin (green), nuclei (blue) and FRC differentiation marker ICAM-1 (red) staining on a high scoring surface T2_PS_2216 and low scoring T2_PS_0344. Actin was stained with phalloidin, nuclei were stained with DAPI. (C) Distribution of ICAM-1 expression in surfaces selected for further validation.

Citation

Aliaksei S. Vasilevich, Frédéric Mourcin, Anouk Mentink, Frits Hulshof, Nick Beijer, Yiping Zhao, Marloes Levers, Bernke Papenburg, Shantanu Singh, Anne E. Carpenter, Dimitrios Stamatialis, Clemens van Blitterswijk, Karin Tarte, Jan de Boer. Designed Surface Topographies Control ICAM-1 Expression in Tonsil-Derived Human Stromal Cells. Frontiers in Bioengineering and Biotechnology 6, 87 (2018). https://doi.org/10.3389/fbioe.2018.00087

Back to the plate

Figure 3 from CellProfiler 3.0: Next-generation image processing for biology
Figure 3.

2018, PLOS Biology. Well B11.

CellProfiler 3.0: Next-generation image processing for biology

Claire McQuin, Allen Goodman, Vasiliy Chernyshev, Lee Kamentsky, Beth A. Cimini, Kyle W. Karhohs, Minh Doan, Liya Ding, Susanne M. Rafelski, Derek Thirstrup, Winfried Wiegraebe, Shantanu Singh, Tim Becker, Juan C. Caicedo, Anne E. Carpenter

Read the paper

Caption

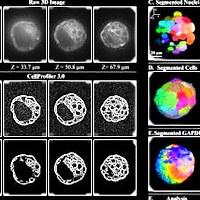
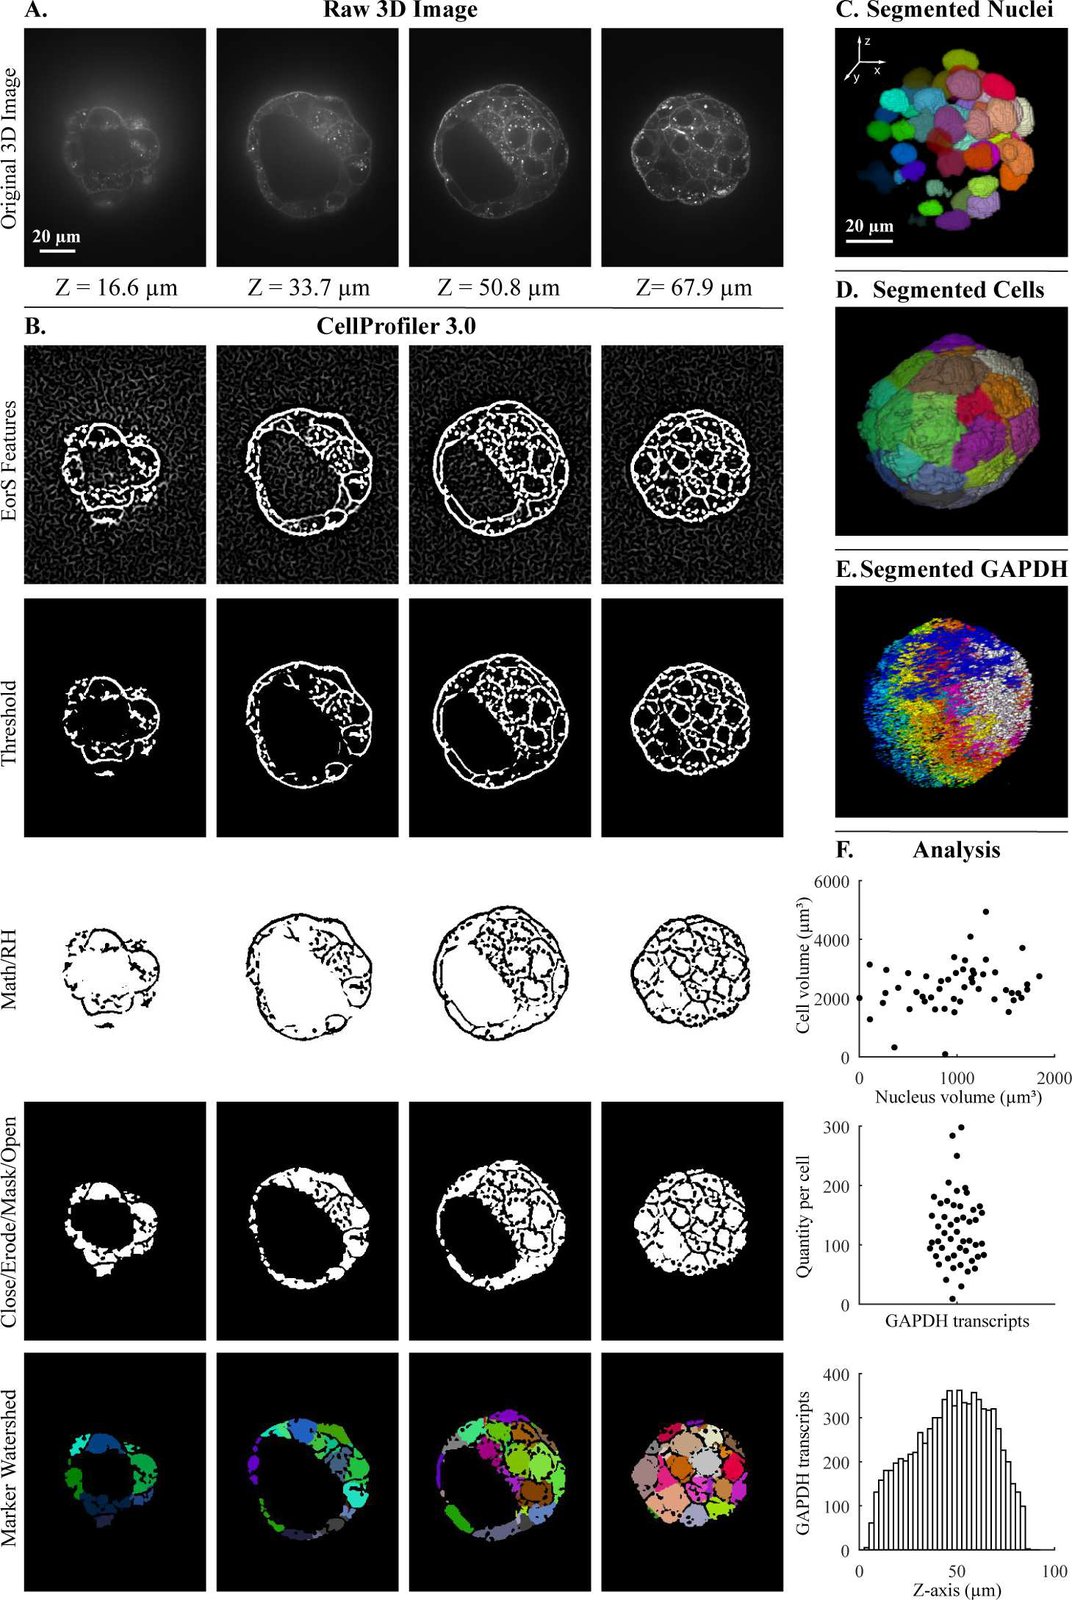
Segmentation steps for the quantification of transcripts per cell within a 3D blastocyst. Images were captured of a mouse embryo blastocyst cell membrane stained with WGA and FISH for GAPDH transcripts. (A) Original 3D image of blastocyst cell membrane prior to analysis. (B) CellProfiler 3.0 image processing modules used for membrane image processing. Figure labels: RH (“RemoveHoles”), Close (“Closing”), Erode (“Erosion”), Mask (“MaskImage”), Math (“ImageMath”), EorS Features (“EnhanceOrSuppressFeatures”). (C) Nuclei after segmentation by CellProfiler, as viewed in Fiji. (D) Segmentation of cells after setting nuclei as seeds by CellProfiler, as viewed in Fiji. (E) Segmentation of GAPDH transcript foci using CellProfiler, as viewed in Fiji. (F) Examples of analysis that can be done by CellProfiler: (top) cell volume relative nucleus volume, (middle) GAPDH transcript quantity in each cell using CellProfiler’s “RelateObjects” module, (bottom) number of GAPDH transcripts in Z-plane (bin size = 2.5 μm). The underlying measurements may be downloaded as S1 File. Images were provided by Javier Frias Aldeguer and Nicolas Rivron from Hubrecht Institute, Netherlands, and are available from the Broad Bioimage Benchmark Collection (https://data.broadinstitute.org/bbbc/BBBC032/). 3D, three-dimensional; FISH, fluorescent in situ hybridization; GAPDH, glyceraldehyde 3-phosphate dehydrogenase; WGA, wheat germ agglutinin.

Citation

Claire McQuin, Allen Goodman, Vasiliy Chernyshev, Lee Kamentsky, Beth A. Cimini, Kyle W. Karhohs, Minh Doan, Liya Ding, Susanne M. Rafelski, Derek Thirstrup, Winfried Wiegraebe, Shantanu Singh, Tim Becker, Juan C. Caicedo, Anne E. Carpenter. CellProfiler 3.0: Next-generation image processing for biology. PLOS Biology 16, 2005970 (2018). https://doi.org/10.1371/journal.pbio.2005970

Back to the plate

2019

Figure 3 from Capturing Single-Cell Phenotypic Variation via Unsupervised Representation Learning
Figure 3.

2019, Medical Imaging with Deep Learning (MIDL 2019), Proceedings of Machine Learning Research. Well B12.

Capturing Single-Cell Phenotypic Variation via Unsupervised Representation Learning

Maxime W. Lafarge, Juan C. Caicedo, Anne E. Carpenter, Josien P.W. Pluim, Shantanu Singh, Mitko Veta

Read the paper

Caption

Translation in VAE+ latent space of a control cell (left) to target cells (right) corresponding to compounds with different mechanisms-of-action. The target cell is the one closest to the mean of the compound. Each interpolation step is a shift of features with highest absolute difference w.r.t. the target features. Cosine similarity between the embedding of an image and its target is shown below each.

Citation

Maxime W. Lafarge, Juan C. Caicedo, Anne E. Carpenter, Josien P. W. Pluim, Shantanu Singh, Mitko Veta. Capturing Single-Cell Phenotypic Variation via Unsupervised Representation Learning. Medical Imaging with Deep Learning (MIDL 2019), Proceedings of Machine Learning Research 102, 315-325 (2019). https://proceedings.mlr.press/v102/lafarge19a.html

Back to the plate

Figure 2 from Capturing single-cell heterogeneity via data fusion improves image-based profiling
Figure 2.

2019, Nature Communications. Well C1.

Capturing single-cell heterogeneity via data fusion improves image-based profiling

Mohammad H. Rohban, Hamdah S. Abbasi, Shantanu Singh, Anne E. Carpenter

Read the paper

Caption

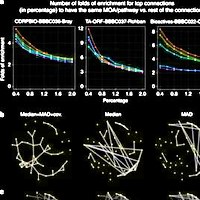
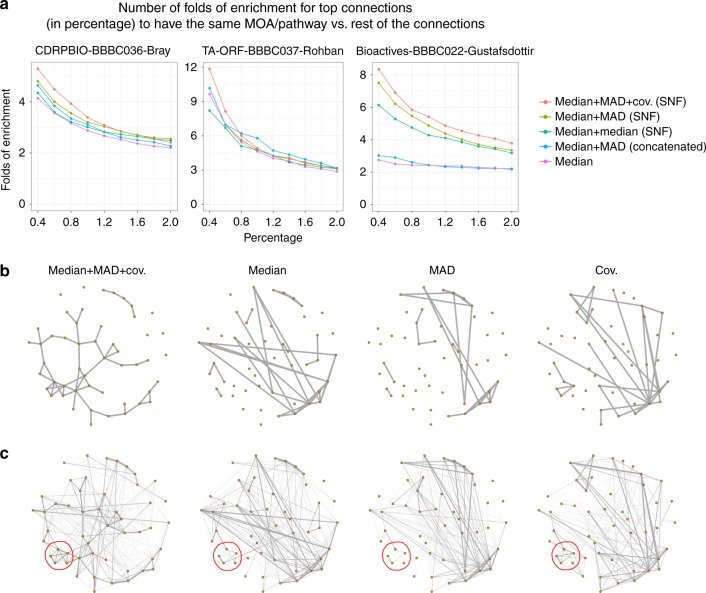
Fusing metrics of cell heterogeneity increases the percentage of validated connections. a When median, MAD and random projections of covariance profiles are combined through SNF (red line), the enrichment in having same MOA/pathway annotations is improved, especially for the strongest, most relevant connections above 0.5%. This is shown in three separate experiments involving small molecules (left, right) and gene overexpression (middle). Enrichment is versus a null distribution, which is based on the remainder of the connections. b Similarity graphs for the mechanism of action (MOA) class Adrenergic receptor antagonists, using different types of profiles in CDRPBIO-BBBC036-Bray. This MOA was chosen because it showed the highest improvement upon combining different profiles. The goal is a qualitative view on how data fusion improves within-MOA connectivities. Each node represents a compound, and two nodes are connected if the similarity of their corresponding profiles is ranked among the top 5% most-similar pairs. Median, MAD, and random projections of covariance profiles seem to be complementary for this MOA, as they cover mostly non-overlapping compound connections. The overall connectivity of compounds in this MOA is improved once these profiles are combined through SNF. Graph layouts are the same across data types and are based on the similarities in median + MAD + cov. (SNF); note that this causes the left-most graph to appear less cluttered and less connected, but the main purpose of the visualization is to observe the structure of connections, not the number of connections (which is quantified systematically in part a). c Weighted similarity graph as in the previous plot except that edge thicknesses are based on an exponential weighting of the ranked similarity values. Sub-clusters that are moderately present in two or three profile types (such as the one marked in red in bottom left) became stronger after applying data fusion using SNF.

Citation

Mohammad H. Rohban, Hamdah S. Abbasi, Shantanu Singh, Anne E. Carpenter. Capturing single-cell heterogeneity via data fusion improves image-based profiling. Nature Communications 10, 2082 (2019). https://doi.org/10.1038/s41467-019-10154-8

Back to the plate

Figure 2 from Evaluation of Deep Learning Strategies for Nucleus Segmentation in Fluorescence Images
Figure 2.

2019, Cytometry Part A. Well C2.

Evaluation of Deep Learning Strategies for Nucleus Segmentation in Fluorescence Images

Juan C. Caicedo, Jonathan Roth, Allen Goodman, Tim Becker, Kyle W. Karhohs, Matthieu Broisin, Csaba Molnar, Claire McQuin, Shantanu Singh, Fabian J. Theis, Anne E. Carpenter

Read the paper

Caption

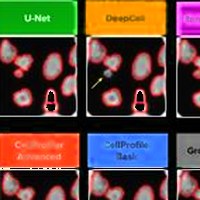
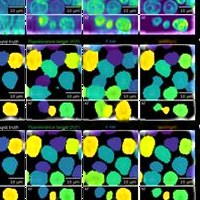
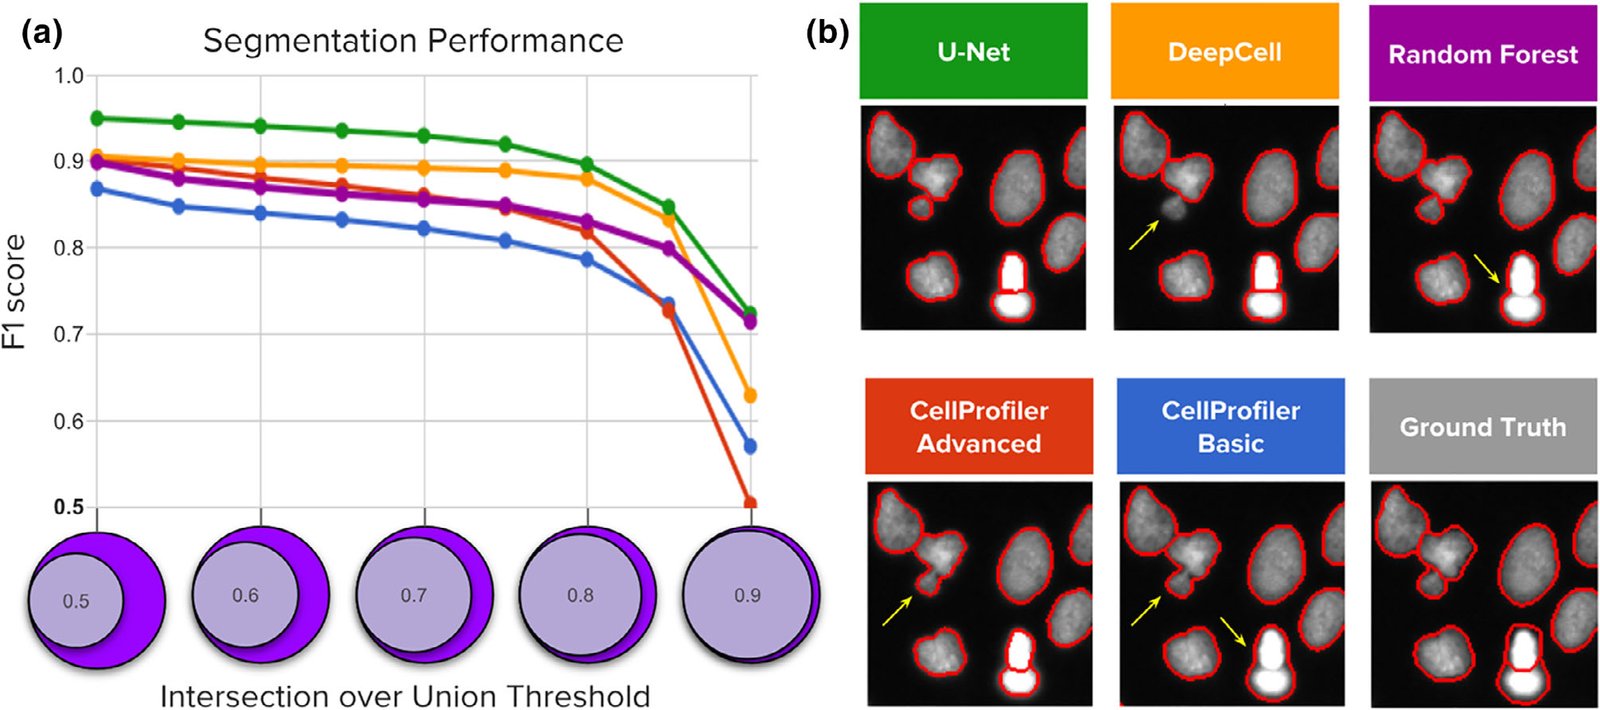
Segmentation performance of five strategies compared against ground‐truth expert segmentations. (a) Average F1‐score versus nucleus coverage for U‐Net (green), DeepCell (yellow), Random Forest (purple), CellProfiler advanced (red), and CellProfiler basic (blue). The y axis is average F1‐score (higher is better), which measures the proportion of correctly segmented objects. The x axis represents intersection‐over‐union (IoU) thresholds as a measurement of how well aligned the ground truth and estimated segmentations must be to count a correctly detected nucleus. Higher thresholds indicate stricter boundary matching. Notice that average F1‐scores remain nearly constant up to IoU = 0.80; at higher thresholds, performance decreases sharply, which indicates that the proportion of correctly segmented objects decreases when stricter boundaries are required to count a positive detection. (b) Example segmentations obtained with each of the five evaluated methods sampled to illustrate performance differences. Segmentation boundaries are in red, and errors are indicated with yellow arrows.

Citation

Juan C. Caicedo, Jonathan Roth, Allen Goodman, Tim Becker, Kyle W. Karhohs, Matthieu Broisin, Csaba Molnar, Claire McQuin, Shantanu Singh, Fabian J. Theis, Anne E. Carpenter. Evaluation of Deep Learning Strategies for Nucleus Segmentation in Fluorescence Images. Cytometry Part A 95, 952-965 (2019). https://doi.org/10.1002/cyto.a.23863

Back to the plate

Figure 1 from Nucleus segmentation across imaging experiments: the 2018 Data Science Bowl
Figure 1.

2019, Nature Methods. Well C3.

Nucleus segmentation across imaging experiments: the 2018 Data Science Bowl

Juan C. Caicedo, Allen Goodman, Kyle W. Karhohs, Beth A. Cimini, Jeanelle Ackerman, Marzieh Haghighi, CherKeng Heng, Tim Becker, Minh Doan, Claire McQuin, Mohammad Rohban, Shantanu Singh, Anne E. Carpenter

Read the paper

Caption

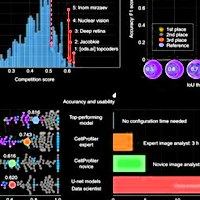
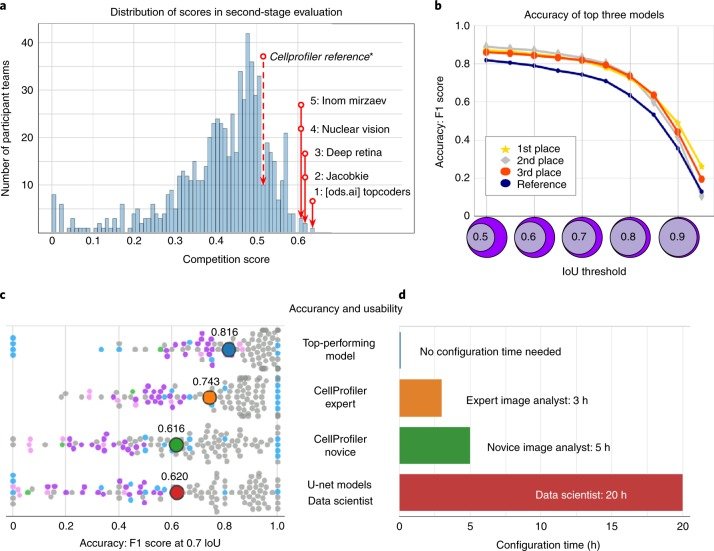
Accuracy and usability of segmentation strategies in the second-stage holdout sets. a, The histogram counts participant teams (n = 739) according to the official competition score of their best submission. The top five competitors are labeled in the distribution, as is the reference segmentation obtained by an expert analyst using CellProfiler. b, Accuracy of the top three solutions measured as the F1 score at multiple IoU thresholds. The scale of the x axis of the histogram in panel a (competition score) is correlated with the area under the curve of the F1 score versus IoU thresholds. The top three models had a similar performance with slight differences at the tails of the curves. c, Breakdown of accuracy in the second-stage evaluation set for the top performing model and three reference solutions. The distribution of F1-scores at a single IoU threshold (IoU = 0.7) shows points (n = 106) that each represented the segmentation accuracy of one image in the set of 106 annotated images of the second-stage evaluation (Methods). The color of single-image points corresponds to the group of images defined for reference evaluations (Methods and Fig. 2). The average of the distribution is marked with a larger point labeled with the corresponding average accuracy value. d, Estimated time required to configure the segmentation tools evaluated in c (Supplementary Note 4).

Citation

Juan C. Caicedo, Allen Goodman, Kyle W. Karhohs, Beth A. Cimini, Jeanelle Ackerman, Marzieh Haghighi, CherKeng Heng, Tim Becker, Minh Doan, Claire McQuin, Mohammad Rohban, Shantanu Singh, Anne E. Carpenter. Nucleus segmentation across imaging experiments: the 2018 Data Science Bowl. Nature Methods 16, 1247-1253 (2019). https://doi.org/10.1038/s41592-019-0612-7

Back to the plate

2020

Figure 2 from Label‐Free Leukemia Monitoring by Computer Vision
Figure 2.

2020, Cytometry Part A. Well C4.

Label‐Free Leukemia Monitoring by Computer Vision

Minh Doan, Marian Case, Dino Masic, Holger Hennig, Claire McQuin, Juan Caicedo, Shantanu Singh, Allen Goodman, Olaf Wolkenhauer, Huw D. Summers, David Jamieson, Frederik W van Delft, Andrew Filby, Anne E. Carpenter, Paul Rees, Julie Irving

Read the paper

Caption

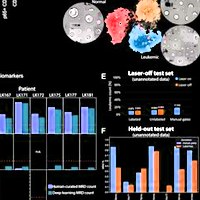
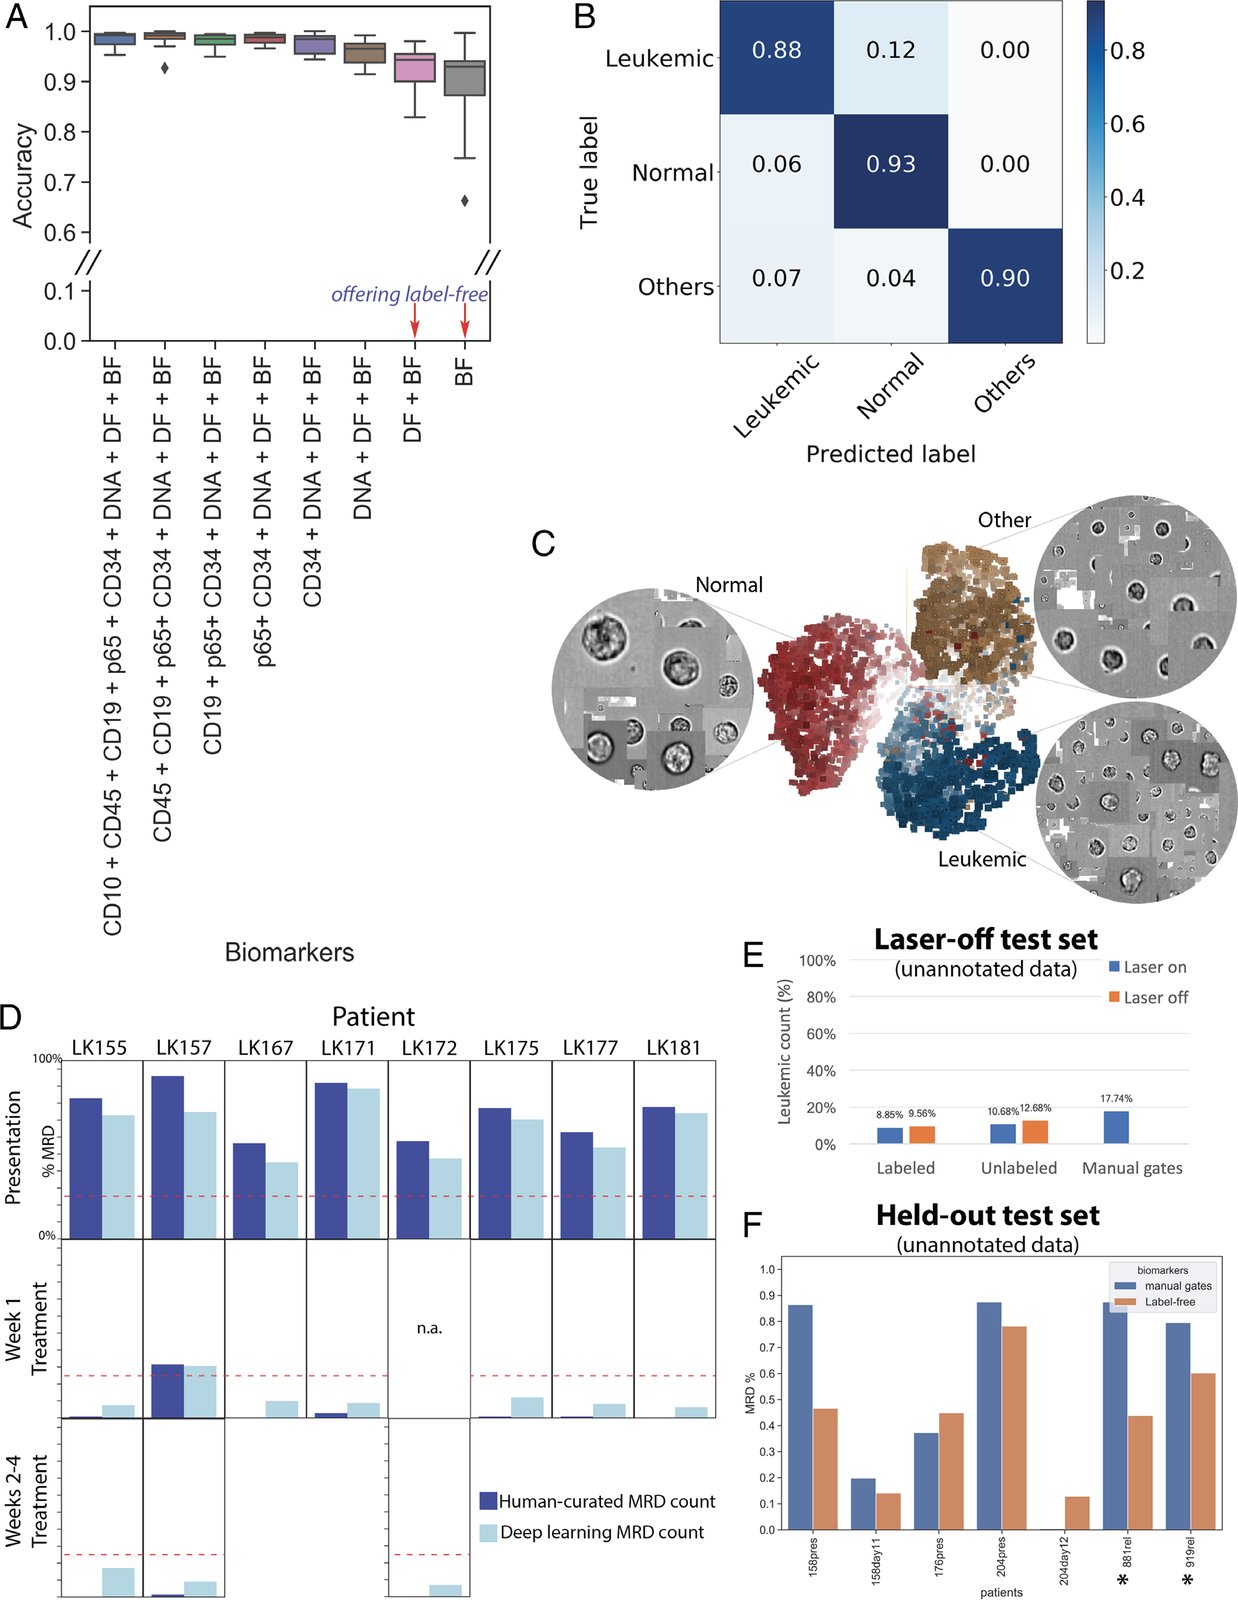
Label‐free identification of ALL cells by ResNet50 corresponds well with biomarker‐based analysis. (A) Prediction results on each of 11 test data entries from five patients, who have data at the time of presentation and during treatment (average accuracy from single‐cell classification) (Test 1). The first column reports average accuracy across samples using all channels; subsequent columns correspond to incremental dropping of the next channel. BF, bright‐field; DF, dark‐field. Boxplots show the median line, first and third quartiles. Whiskers are drawn to double interquartile range (+2IQR). Diamonds represent data events that are outside the low and high whisker ends. (B) Three‐class single‐cell classification using bright‐field and dark‐field channels (Test 1). Confusion matrix for three categories, n = 218,747 ground‐truth cells pooled from 11 test sets. (C) Clustering of 9,025 cells randomly sampled from patient LK157 at the time of presentation based on deep learning features. 3D t‐Distributed Stochastic Neighbor Embedding (t‐SNE)(20) presentations based on 2,048 label‐free feature vectors for each cell from the second‐to‐last layer of the trained neural network, ResNet50, are shown. The t‐SNE calculation was stabilized after 400 iterations at perplexity of 30. Colors coded according to true class labels: Leukemic cells (blue), normal B lymphocytes (red), other cell types (yellow). The magnified images display true bright‐field channel, randomly zoomed at each cluster. Example data with overlaid images http://projector.tensorflow.org/?config=raw.githubusercontent.com/minh‐doan/Deeplearning_LabelFree_Leukemia/master/Publish/DL_supervised/Data/Step4/Output/projector_config.pbtxt can be visualized with a web‐based projector. (D) Comparison between human‐curated manual gates and label‐free deep learning in predicting residual disease fraction (Test 2). The prediction on each sample was performed on the DAPI‐positive population of in‐focus, white blood cells, which is a mixture of leukemic blasts, normal B lymphocytes, other mature and immature hematopoietic cells such as granulocytes and monocytes. Red dash‐line is 25%—the threshold of treatment effectiveness of chemotherapy. (E) Summary of residual disease estimated by deep learning using information in bright‐field channel of labeled/unlabeled samples (each with laser on/off settings) (Test 3). Residual disease fraction was calculated as the percentage of predicted leukemic cells over the whole population of unannotated in‐focus single cells. For reference, human‐curated manual residual disease fraction (last blue column) was estimated based on the stained version with laser on. (F) Result of label‐free deep learning residual disease readout (yellow columns) on unannotated in‐focus single cells in held‐out data (Test 4). Blue columns are residual disease readout reported by standard clinical flow cytometric protocol. LK881 and LK919 (asterisks) are relapsed ALL patients.

Citation

Minh Doan, Marian Case, Dino Masic, Holger Hennig, Claire McQuin, Juan Caicedo, Shantanu Singh, Allen Goodman, Olaf Wolkenhauer, Huw D. Summers, David Jamieson, Frederik W. van Delft, Andrew Filby, Anne E. Carpenter, Paul Rees, Julie Irving. Label-Free Leukemia Monitoring by Computer Vision. Cytometry Part A 97, 407-414 (2020). https://doi.org/10.1002/cyto.a.23987

Back to the plate

Figure 3 from Objective assessment of stored blood quality by deep learning
Figure 3.

2020, Proceedings of the National Academy of Sciences. Well C5.

Objective assessment of stored blood quality by deep learning

Minh Doan, Joseph A. Sebastian, Juan C. Caicedo, Stefanie Siegert, Aline Roch, Tracey R. Turner, Olga Mykhailova, Ruben N. Pinto, Claire McQuin, Allen Goodman, Michael J. Parsons, Olaf Wolkenhauer, Holger Hennig, Shantanu Singh, Anne Wilson, Jason P. Acker, Paul Rees, Michael C. Kolios, Anne E. Carpenter

Read the paper

Caption

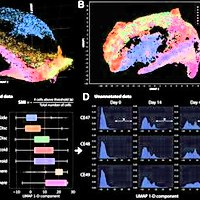
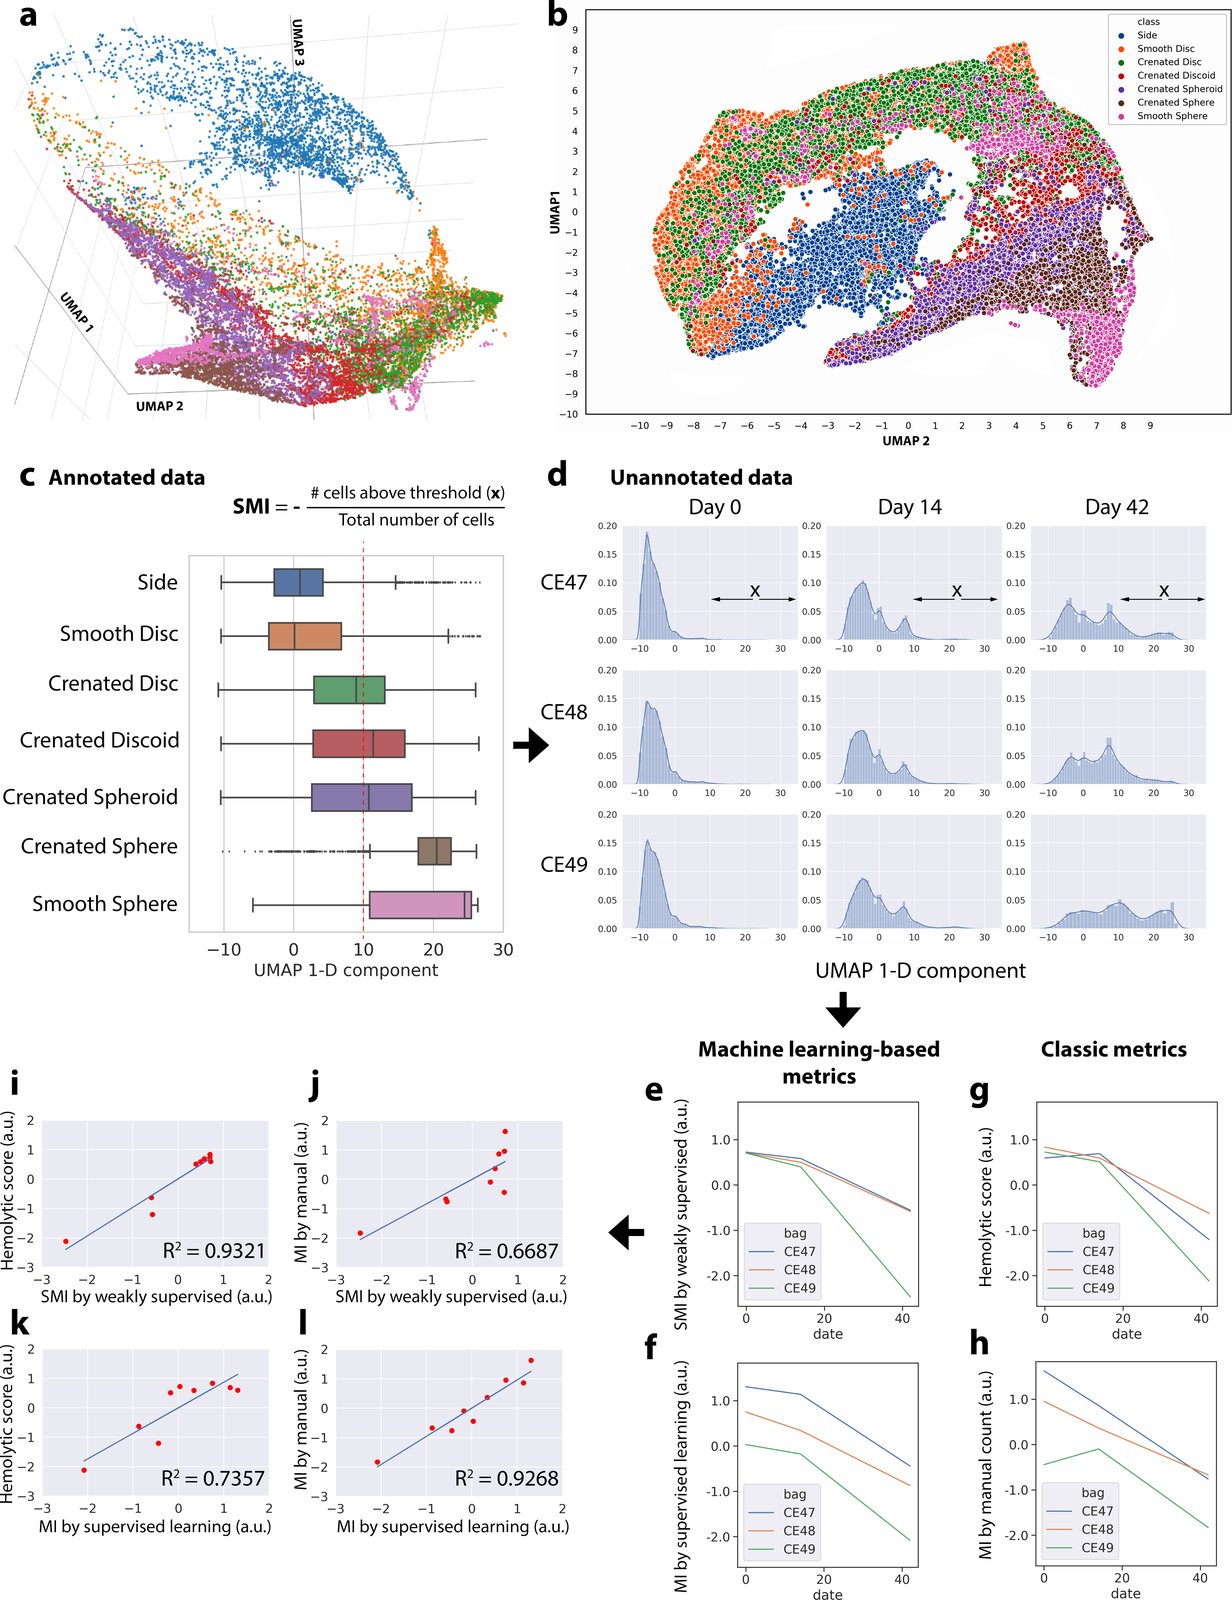
Data-driven ordering of RBC morphologies by weakly supervised learning allows robust blood quality assessment. (A–C) We discovered a relatively linear progression for major morphological classes of RBCs using features extracted from an intermediate layer (Res4a_ReLU) of the trained weakly supervised model projected into low-dimensional space using a UMAP algorithm. This continuum is observed in 3D (A), 2D (B), or 1D (C) embedding space and interactive 3D-PCA, t-SNE, and UMAP projections of 7,000 representative cells can be explored in a public browser-based tool (ref. 36; select colors and labels for better visualization). Color coding in A, B, and C is consistent, showing that the extracted weakly supervised features place cells along their correct biological progression, from discocytes (smooth discs, crenated discs) to echinocytes (crenated discoids, crenated spheroids, crenated spheres) to spherocytes (smooth sphere). The boxes in A overlap due to continuous transitions between morphology categories, which could not be further resolved by the chosen ResNet50 architecture. The red dotted line in C indicates the threshold in the 1D UMAP, above which RBCs were categorized as unhealthy; this includes most spheroechinocytes (crenated spheroid, crenated spheres, and smooth spheres). The increasing fraction of unhealthy cells (x) over the total number of cells is termed SMI. (D) Distribution of unannotated cells according to the 1D UMAP of weakly supervised features. For each blood unit, deep-learning features were extracted from label-free images of 20,000 cells by a trained weakly supervised neural network. The extracted features were then projected in 1D UMAP space (x axis of each histogram). The shift of distributions from the left to the right as time progresses is clearly visible (more healthy biconcave RBCs are toward the negative end of the x axis; spheroechinocytes are toward the positive end). (E–H) Results from different approaches for evaluating the quality of blood units, with the y axes unified to the same scale. (E) Blood quality according to the proposed SMI. (F) Blood quality according to our automated MI morphology analysis using a fully supervised classifier. (G) Blood quality as assessed by a physiological assay for hemolysis. (H) Blood quality as assessed by expert manual MI morphology analysis (∼4,000 cells per blood unit per time point). (I–L) Pairwise comparisons between proposed machine learning approaches and classic methods for evaluating the quality of red cell units. (I) There is a stronger correlation between the proposed weakly supervised-based quality assessment and hemolytic readouts (coefficient of determination, R2 = 0.93) than that of (J) human manual annotations of morphology (R2 = 0.67). (K and L) In contrast, the proposed supervised learning-based method shows the opposite trend. The x and y axes of plots I–L were unified to the same scale.

Citation

Minh Doan, Joseph A. Sebastian, Juan C. Caicedo, Stefanie Siegert, Aline Roch, Tracey R. Turner, Olga Mykhailova, Ruben N. Pinto, Claire McQuin, Allen Goodman, Michael J. Parsons, Olaf Wolkenhauer, Holger Hennig, Shantanu Singh, Anne Wilson, Jason P. Acker, Paul Rees, Michael C. Kolios, Anne E. Carpenter. Objective assessment of stored blood quality by deep learning. Proceedings of the National Academy of Sciences 117, 21381-21390 (2020). https://doi.org/10.1073/pnas.2001227117

Back to the plate

Figure 7 from TFEB Transcriptional Responses Reveal Negative Feedback by BHLHE40 and BHLHE41
Figure 7.

2020, Cell Reports. Well C6.

TFEB Transcriptional Responses Reveal Negative Feedback by BHLHE40 and BHLHE41

Kimberly L. Carey, Geraldine L.C. Paulus, Lingfei Wang, Dale R. Balce, Jessica W. Luo, Phil Bergman, Ianina C. Ferder, Lingjia Kong, Nicole Renaud, Shantanu Singh, Maria Kost-Alimova, Beat Nyfeler, Kara G. Lassen, Herbert W. Virgin, Ramnik J. Xavier

Read the paper

Caption

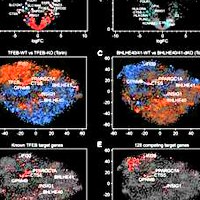
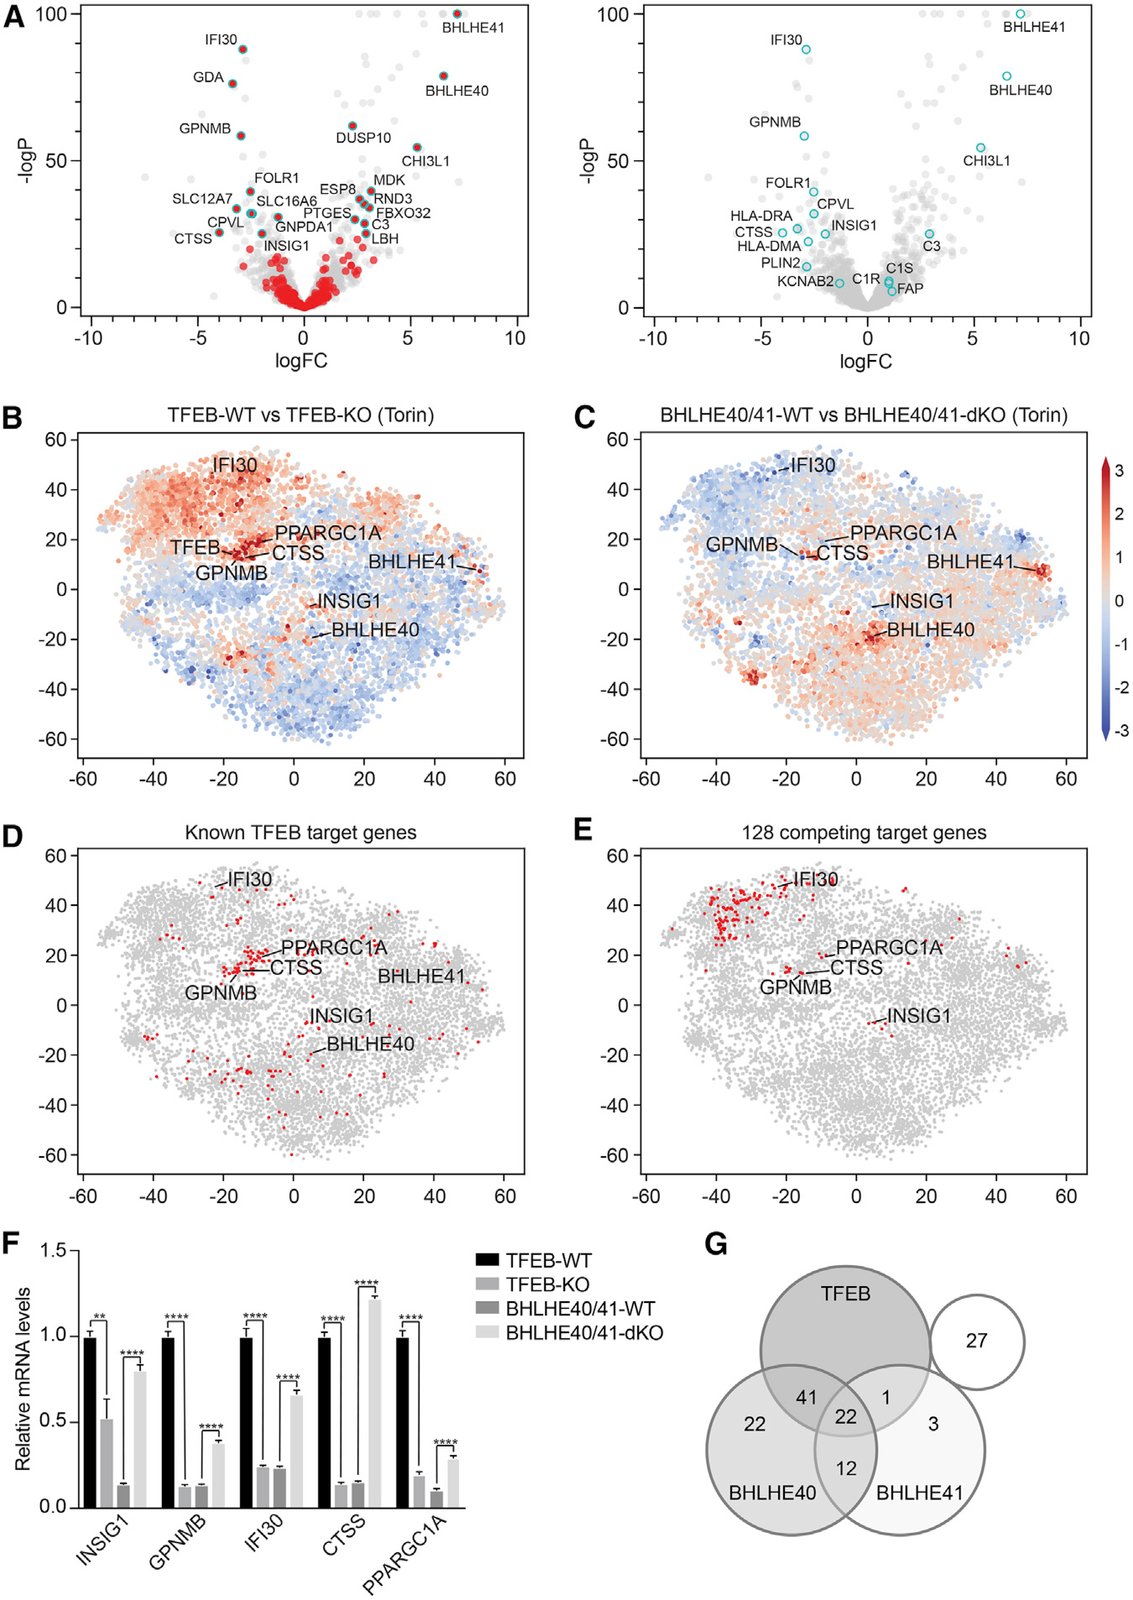
BHLHE40 and BHLHE41 Repress Expression of Select TFEB Target Genes through a Negative Feedback Loop. (A) Volcano plots depicting differential gene expression in BHLHE40/41-WT versus BHLHE40/41-KO reconstituted cells at steady state. Highlighted in red (left panel) are genes significantly upregulated in TFEB-WT versus TFEB-KO cells following Torin treatment (logFC > ln4 and q < 0.01). Highlighted in cyan (right panel) are select TFEB target genes. (B–E) tSNE plots representing all RNA sequencing datasets in our study. Comparison of RNA sequencing datasets from (B) TFEB-WT and TFEB-KO cells or (C) BHLHE40/41-WT and BHLHE40/41-dKO cells treated with Torin, in which each gene (dot) is colored by the logFC. (D) Known TFEB target genes or (E) strongest putative TFEB and BHLHE40/41 competing target genes are highlighted in red. (F) Gene expression of select TFEB and BHLHE40/41 target genes in TFEB-KO, TFEB-WT, BHLHE40/41-dKO, and BHLHE40/41-WT cells as quantified by qRT-PCR. By two-tailed t test analyses, all genes were significantly upregulated in cells reconstituted with TFEB and downregulated in those reconstituted with BHLHE40/41. Data are representative from three independent experiments (mean ± SEM [standard error of the mean]). **p < 0.006, ****p < 0.0001. (G) Venn diagram represents the number of the 128 strongest putative competing target genes (logFC > ln2 and < −ln2 in TFEB- and BHLHE40/41-WT versus TFEB- and BHLHE40/41-KO cells, respectively, and q < 0.05 in both) bound by TFEB, BHLHE40, and/or BHLHE41 based on the published ChIP-seq datasets GEO: GSM2354032, GSE106000, GSM2797493, and GSM2461743. See also Figure S6 and Tables S7 and S8.

Citation

Kimberly L. Carey, Geraldine L. C. Paulus, Lingfei Wang, Dale R. Balce, Jessica W. Luo, Phil Bergman, Ianina C. Ferder, Lingjia Kong, Nicole Renaud, Shantanu Singh, Maria Kost-Alimova, Beat Nyfeler, Kara G. Lassen, Herbert W. Virgin, Ramnik J. Xavier. TFEB Transcriptional Responses Reveal Negative Feedback by BHLHE40 and BHLHE41. Cell Reports 33, 108371 (2020). https://doi.org/10.1016/j.celrep.2020.108371

Back to the plate

Figure 1 from On the correlation between material-induced cell shape and phenotypical response of human mesenchymal stem cells
Figure 1.

2020, Scientific Reports. Well C7.

On the correlation between material-induced cell shape and phenotypical response of human mesenchymal stem cells

Aliaksei S. Vasilevich, Steven Vermeulen, Marloes Kamphuis, Nadia Roumans, Said Eroumé, Dennie G. A. J. Hebels, Jeroen van de Peppel, Rika Reihs, Nick R. M. Beijer, Aurélie Carlier, Anne E. Carpenter, Shantanu Singh, Jan de Boer

Read the paper

Caption

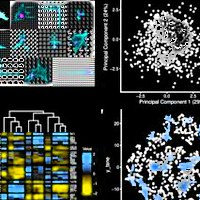
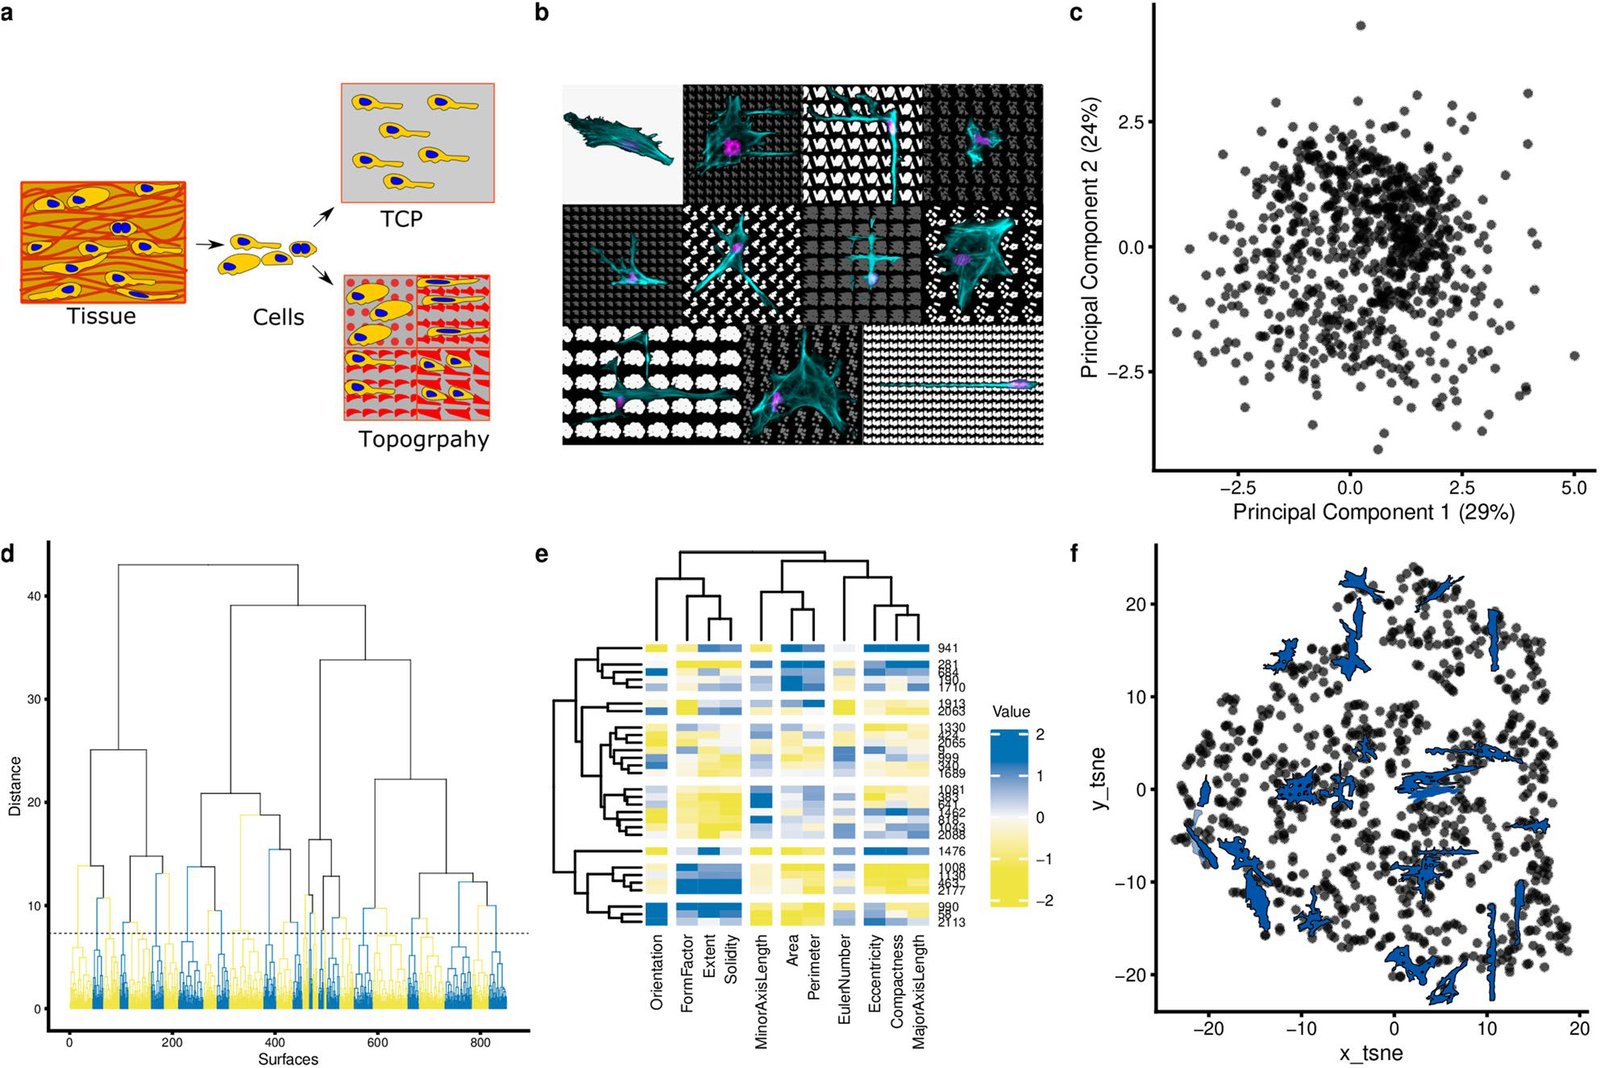
Clustering of cell shape diversity. (a) Surface topography as a model system to investigate cell shape-induced cells response. TCP: tissue culture polystyrene. The schematic was prepared in the Inkscape 0.92.4. (b) The montage image that represents the diverse cell of hMSCs seeded on different topographies and flat surface (upper, left). Nuclei were stained with DAPI (magenta), actin was stained with phalloidin (cyan). The collage was prepared in the GIMP v 2.10.14. (c) Principal components analysis of all cell shapes on the TopoChip. The first two principal components are shown. Note that no noticeable clusters are observed. (d) Cluster gram representing a clustering of TopoChip cell shape data. Blue and yellow colours distinguish different clusters. (e) Heatmap representing the median values of cell shape features on the chosen medoid topographies. (f) tSNE (t-distributed stochastic neighbor embedding) visualization of the obtained clusters. Cells shape silhouettes on 28 selected surfaces are represented.

Citation

Aliaksei S. Vasilevich, Steven Vermeulen, Marloes Kamphuis, Nadia Roumans, Said Eroumé, Dennie G. A. J. Hebels, Jeroen van de Peppel, Rika Reihs, Nick R. M. Beijer, Aurélie Carlier, Anne E. Carpenter, Shantanu Singh, Jan de Boer. On the correlation between material-induced cell shape and phenotypical response of human mesenchymal stem cells. Scientific Reports 10, 18988 (2020). https://doi.org/10.1038/s41598-020-76019-z

Back to the plate

Figure 2 from Evolutionary design of optimal surface topographies for biomaterials
Figure 2.

2020, Scientific Reports. Well C8.

Evolutionary design of optimal surface topographies for biomaterials

Aliaksei Vasilevich, Aurélie Carlier, David A. Winkler, Shantanu Singh, Jan de Boer

Read the paper

Caption

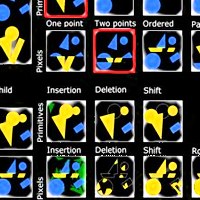
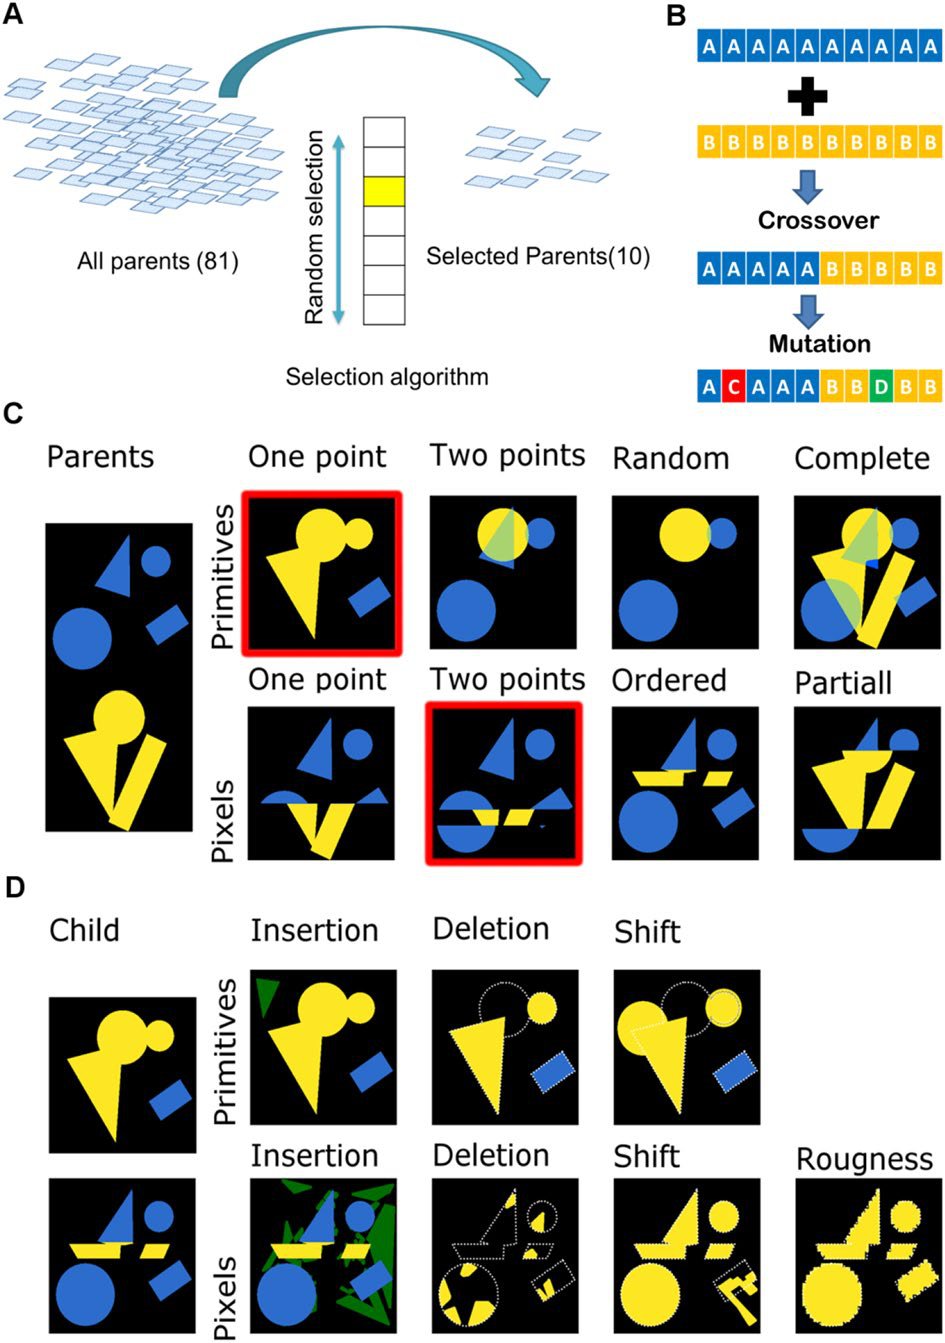
Selecting, recombining and mutating the genetic information of the parents. (A). Schematic representation of surface selection flow at the beginning of each cycle. (B). Schematic representation of crossover and mutation algorithms. (C) Example of different crossover algorithms. Colours (yellow and blue) represent parts from different parents. Surfaces with red outline were selected further to demonstrate mutation algorithms. (D) Example of different mutation algorithms. Green regions correspond to newly-inserted elements of the design; white outlines corresponds to deleted parts.

Citation

Aliaksei Vasilevich, Aurélie Carlier, David A. Winkler, Shantanu Singh, Jan de Boer. Evolutionary design of optimal surface topographies for biomaterials. Scientific Reports 10, 22160 (2020). https://doi.org/10.1038/s41598-020-78777-2

Back to the plate

2021

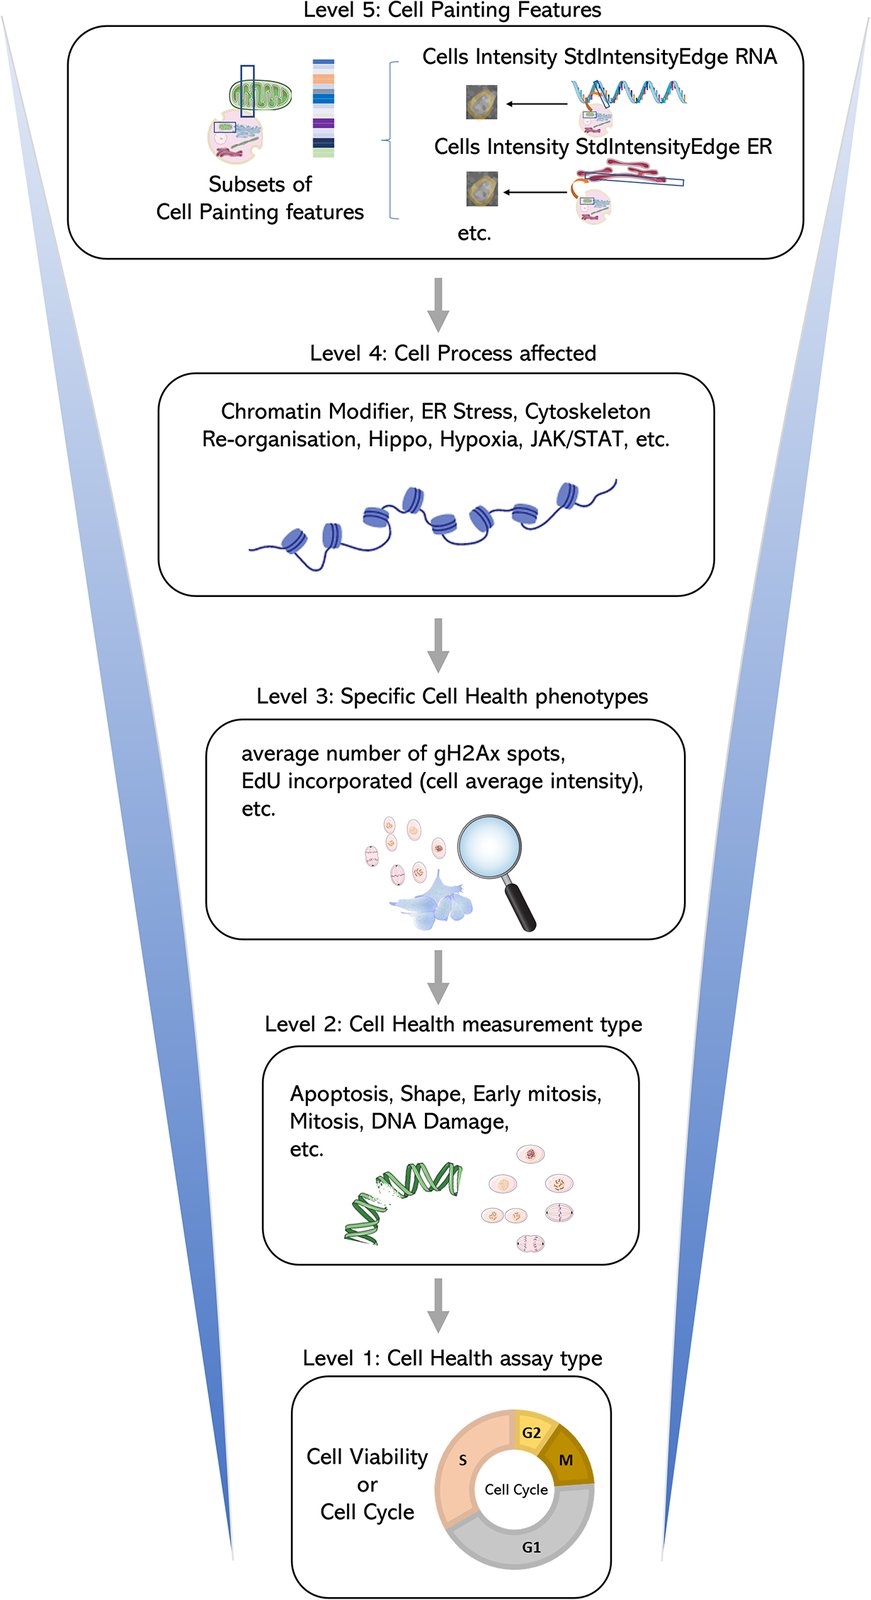
Figure 1 from Predicting cell health phenotypes using image-based morphology profiling
Figure 1.

2021, Molecular Biology of the Cell. Well C9.

Predicting cell health phenotypes using image-based morphology profiling

Gregory P. Way, Maria Kost-Alimova, Tsukasa Shibue, William F. Harrington, Stanley Gill, Federica Piccioni, Tim Becker, Hamdah Shafqat-Abbasi, William C. Hahn, Anne E. Carpenter, Francisca Vazquez, Shantanu Singh

Read the paper

Caption

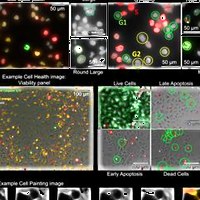
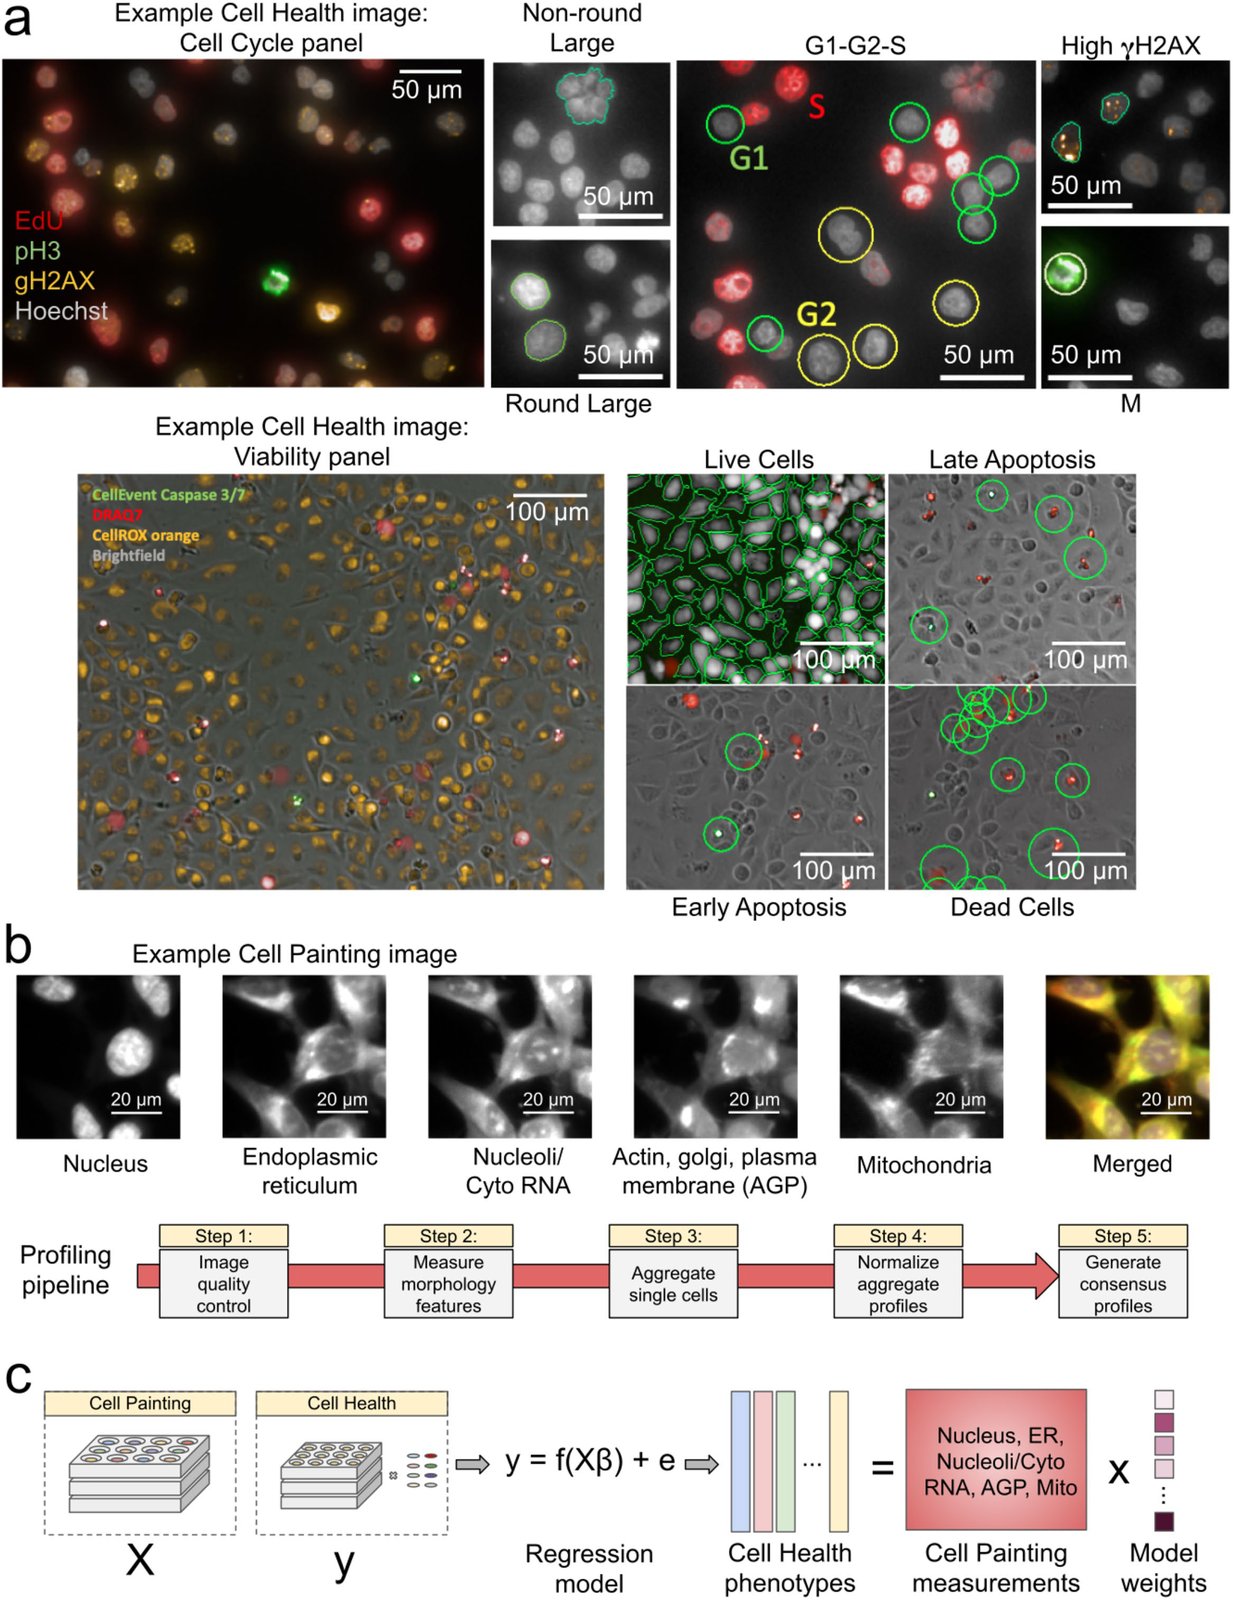
Data processing and modeling approach. (a) Example images and workflow from the Cell Health assays. We apply a series of manual gating strategies (see Materials and Methods) to isolate cell subpopulations and to generate cell health readouts for each perturbation. (Top) In the “Cell Cycle” panel, in each nucleus we measure Hoechst, EdU, PH3, and gH2AX. (Bottom) In the “Viability” panel, we capture DPC images, measure Caspase 3/7, DRAQ7, and CellROX. (b) Example Cell Painting image across five channels, plus a merged representation across channels. The image is cropped from a larger image and shows ES2 cells. Scale bars are 20 µm. Below are the steps applied in an image-based profiling pipeline, after features have been extracted from each cell’s image. (c) Modeling approach where we fit 70 different regression models using CellProfiler features derived from Cell Painting images to predict Cell Health readouts. Model weights refer to the coefficients derived from each regression model.

Citation

Gregory P. Way, Maria Kost-Alimova, Tsukasa Shibue, William F. Harrington, Stanley Gill, Federica Piccioni, Tim Becker, Hamdah Shafqat-Abbasi, William C. Hahn, Anne E. Carpenter, Francisca Vazquez, Shantanu Singh. Predicting cell health phenotypes using image-based morphology profiling. Molecular Biology of the Cell 32, 995-1005 (2021). https://doi.org/10.1091/mbc.E20-12-0784

Back to the plate

Figure 2 from Molecular Diversity of Glutamatergic and GABAergic Synapses from Multiplexed Fluorescence Imaging
Figure 2.

2021, eNeuro. Well C10.

Molecular Diversity of Glutamatergic and GABAergic Synapses from Multiplexed Fluorescence Imaging

Eric Danielson, Karen Perez de Arce, Beth Cimini, Eike-Christian Wamhoff, Shantanu Singh, Jeffrey R. Cottrell, Anne E. Carpenter, Mark Bathe

Read the paper

Caption

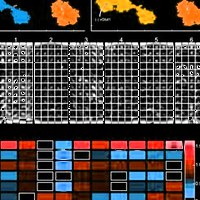
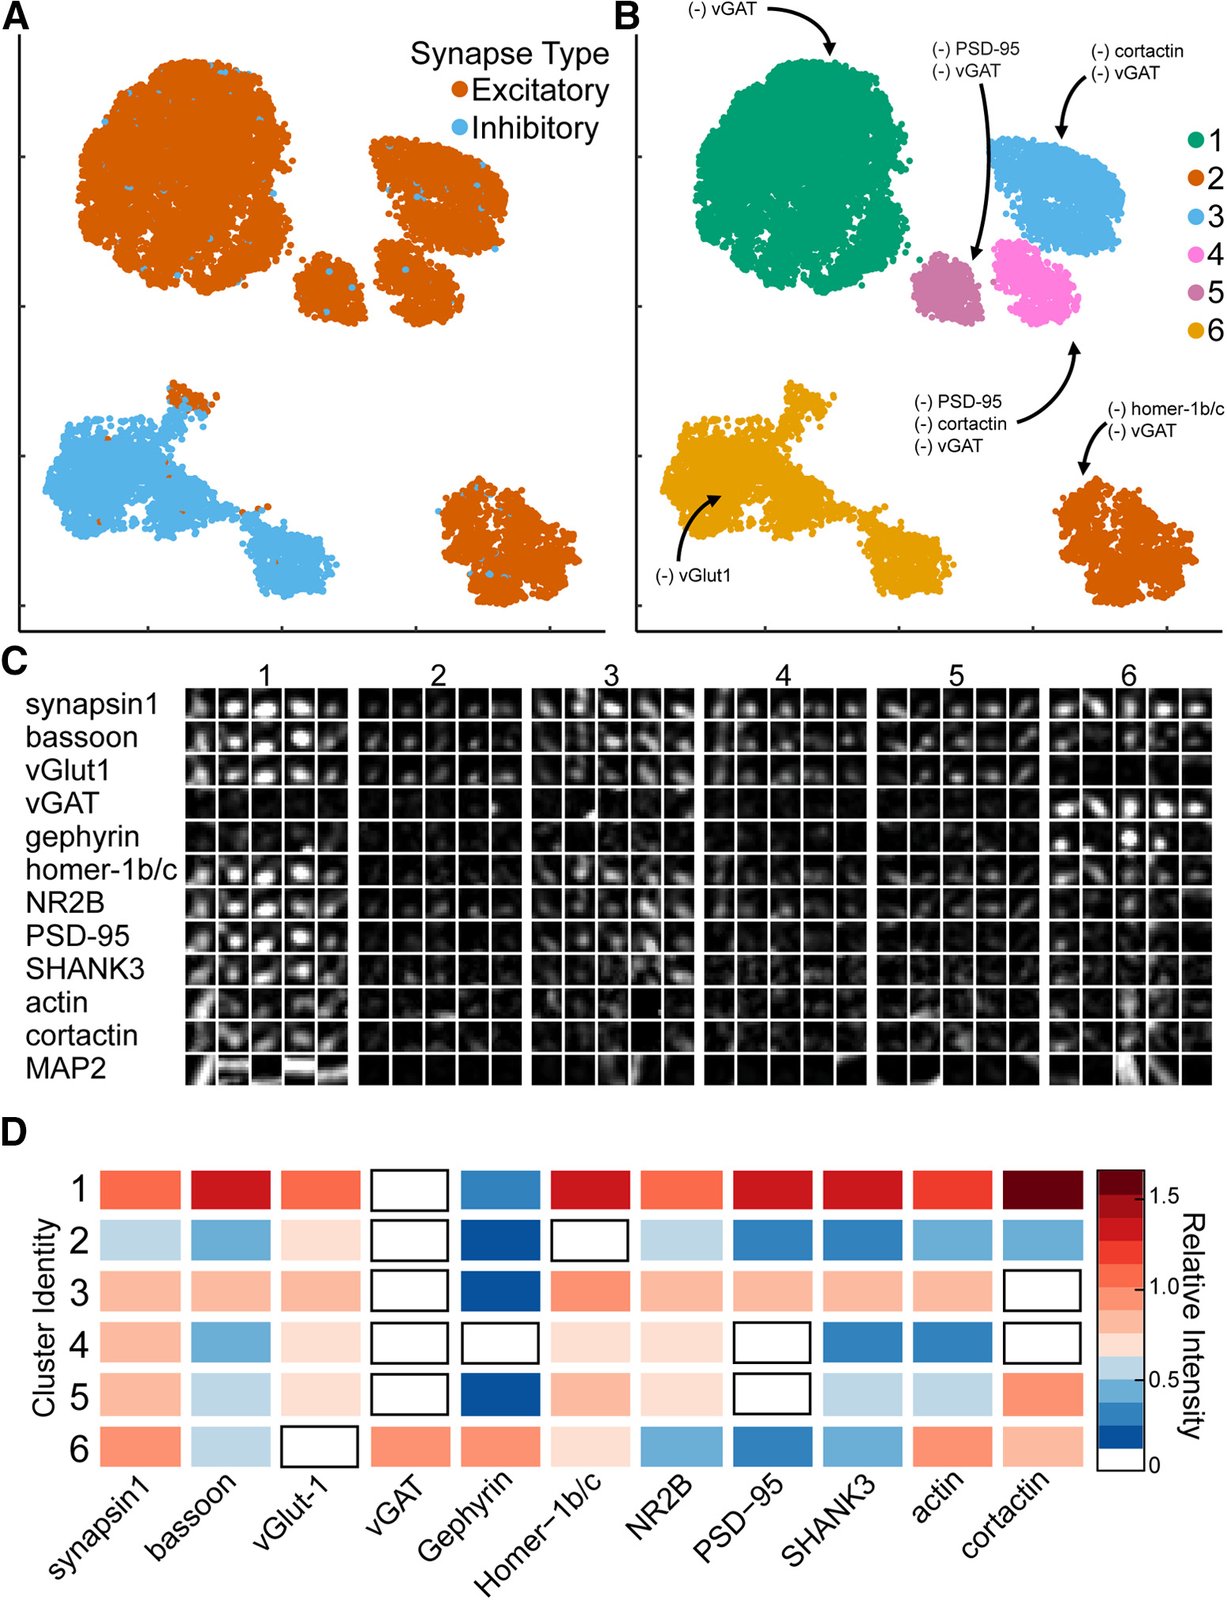
Synaptic cluster identification using UMAP. A, UMAP plots of individual synapses (n = 10,000) using CellProfiler output separates excitatory (red) and inhibitory (blue) synapses into two major clusters with multiple subclusters. B, Unique clusters identified by HDBSCAN. (–) indicates synaptic target below limit of detection. C, Representative synapses from each cluster. D, Heatmap indicates the average relative intensities for each synaptic target within each cluster. All values are normalized to untreated mean integrated intensity.

Citation

Eric Danielson, Karen Perez de Arce, Beth Cimini, Eike-Christian Wamhoff, Shantanu Singh, Jeffrey R. Cottrell, Anne E. Carpenter, Mark Bathe. Molecular Diversity of Glutamatergic and GABAergic Synapses from Multiplexed Fluorescence Imaging. eNeuro 8, ENEURO.0286-20.2020 (2021). https://doi.org/10.1523/ENEURO.0286-20.2020

Back to the plate

2022

Figure 1 from Predicting drug polypharmacology from cell morphology readouts using variational autoencoder latent space arithmetic
Figure 1.

2022, PLOS Computational Biology. Well C11.

Predicting drug polypharmacology from cell morphology readouts using variational autoencoder latent space arithmetic

Yuen Ler Chow, Shantanu Singh, Anne E. Carpenter, Gregory P. Way

Read the paper

Caption

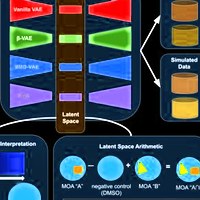
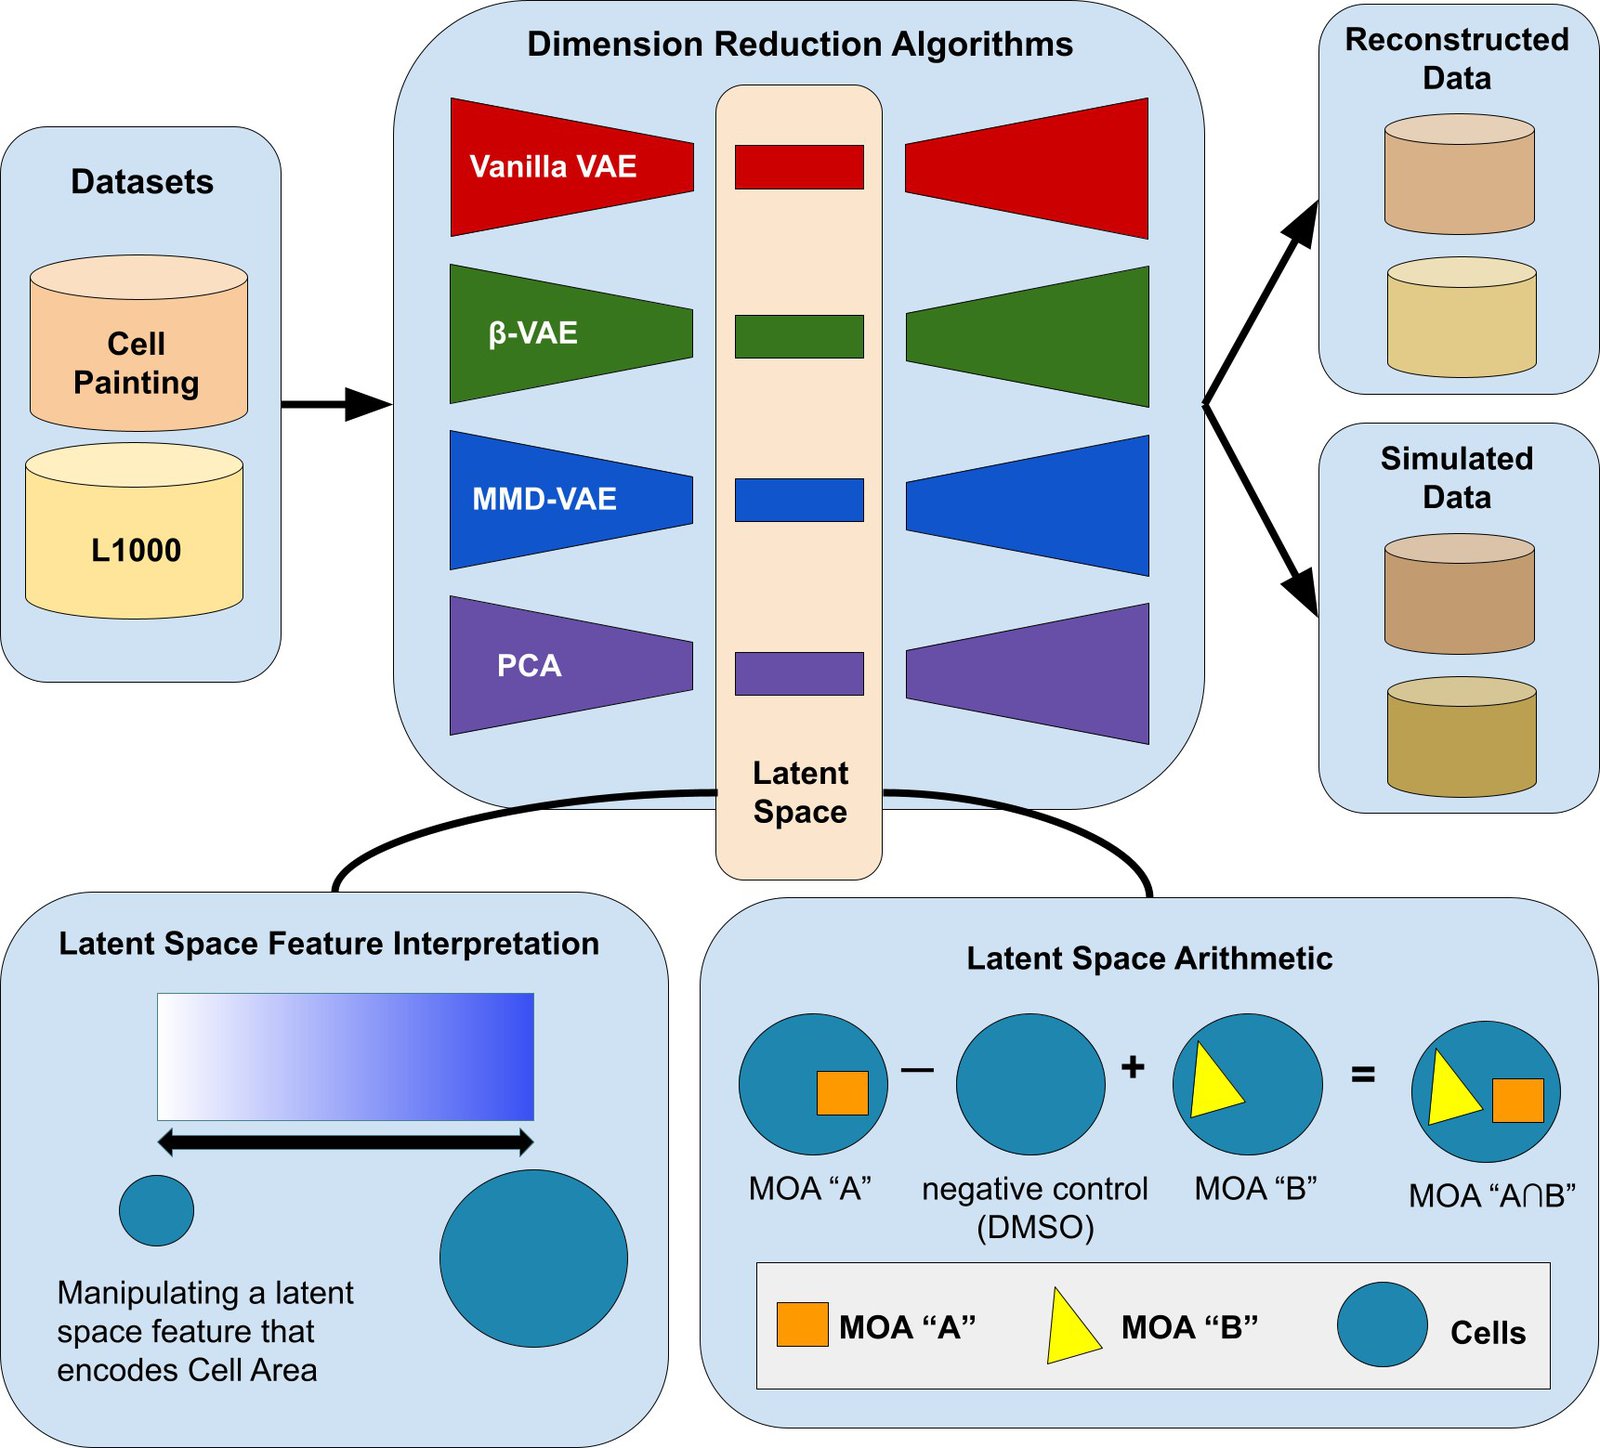
Our variational autoencoder (VAE) implementation framework, applied to determining the phenotype of cells. One application is to predict the phenotype of cells treated with compounds that have two mechanisms of actions (MOA), given the phenotype of cells treated with compounds that have each of those single MOAs (bottom right). A VAE encodes input data into a lower-dimensional latent space and then decodes the representation back into the original data dimensions. Our data contained measurements for 588 morphology features, each averaged for each population of cells treated with a given chemical compound. Following a sweep to select optimal hyperparameters (see Methods), we set our latent space dimension to 10 dimensions. The vanilla VAE learns by minimizing a reconstruction and KL-divergence loss. The other VAE variants we tested minimize loss functions that encourage disentangled features that promote interpretability, data simulation, and enable meaningful LSA.

Citation

Yuen Ler Chow, Shantanu Singh, Anne E. Carpenter, Gregory P. Way. Predicting drug polypharmacology from cell morphology readouts using variational autoencoder latent space arithmetic. PLOS Computational Biology 18, 1009888 (2022). https://doi.org/10.1371/journal.pcbi.1009888

Back to the plate

Figure 2 from Cell Painting predicts impact of lung cancer variants
Figure 2.

2022, Molecular Biology of the Cell. Well C12.

Cell Painting predicts impact of lung cancer variants

Juan C. Caicedo, John Arevalo, Federica Piccioni, Mark-Anthony Bray, Cathy L. Hartland, Xiaoyun Wu, Angela N. Brooks, Alice H. Berger, Jesse S. Boehm, Anne E. Carpenter, Shantanu Singh

Read the paper

Caption

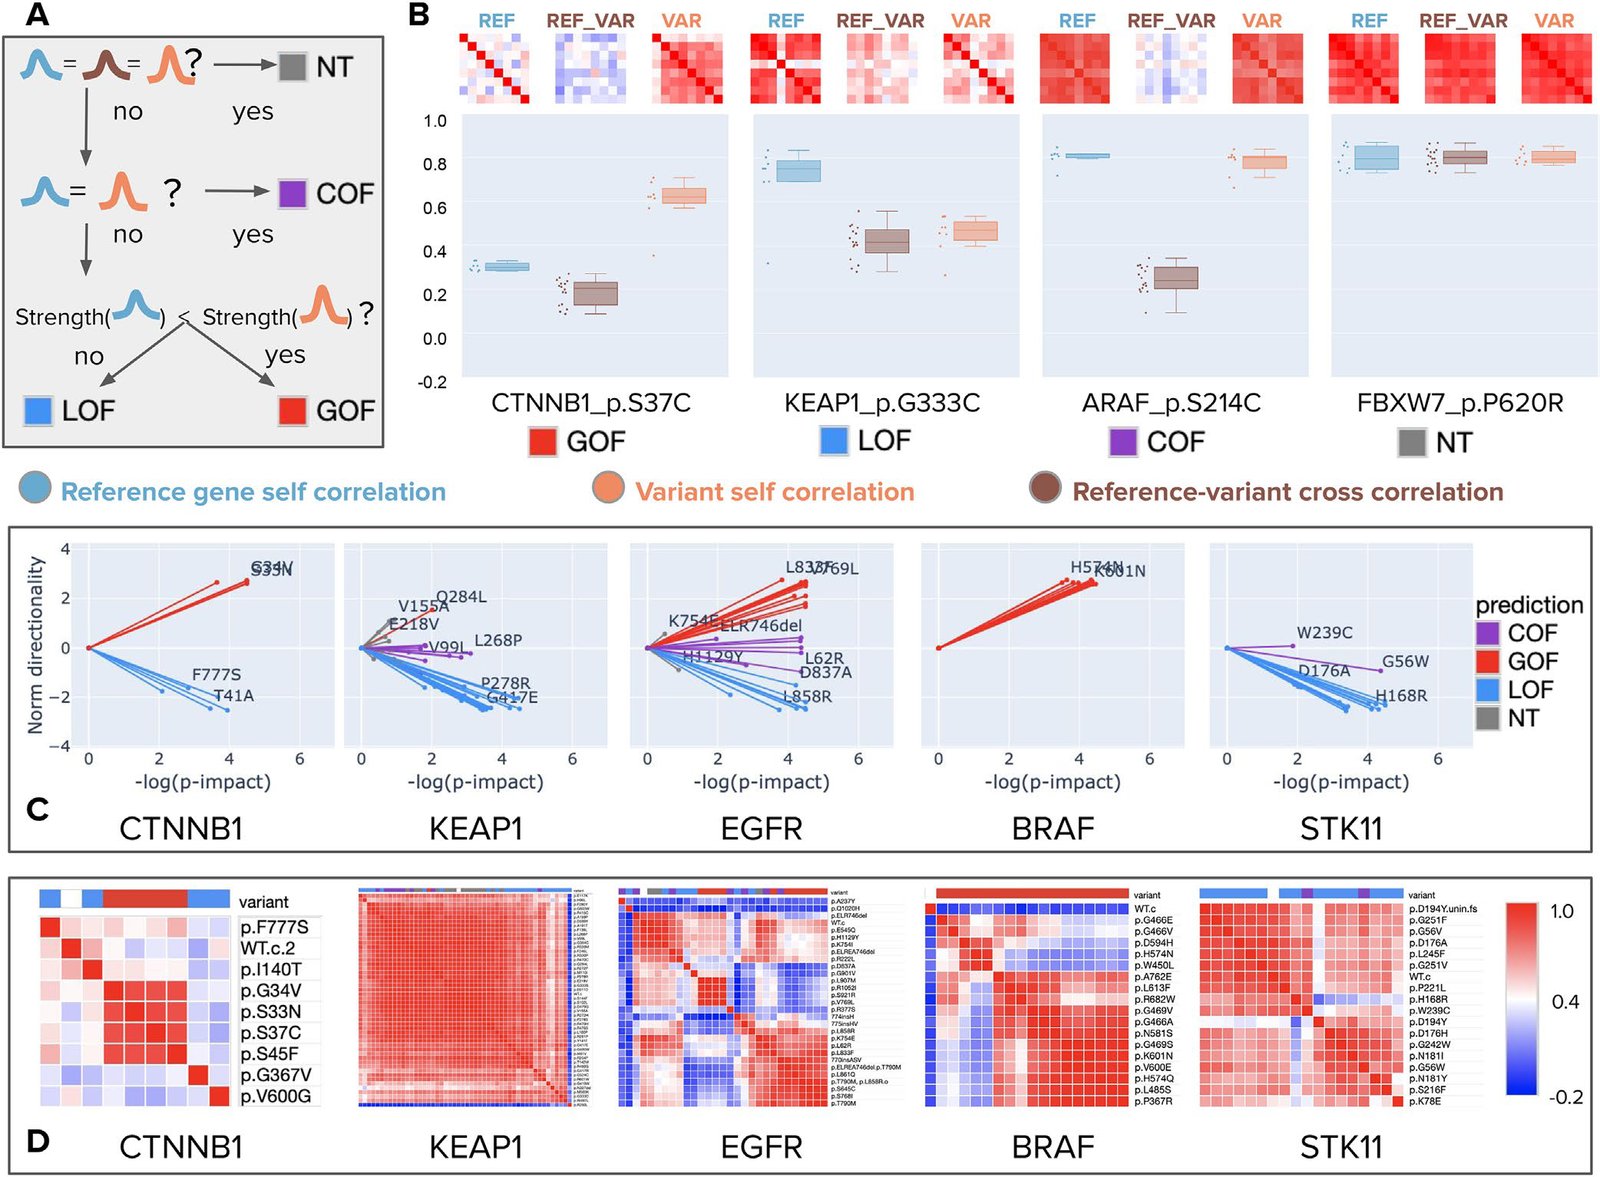
Morphology-based variant impact phenotyping (cmVIP) and resulting predictions in a diverse set of variants. (A) Decision tree of the VIP algorithm (Berger et al., 2017; Thornton et al., 2021), which we adopt for classifying variants by their Cell Painting profiles as gain of function (GOF), loss of function (LOF), change of function (COF), and neutral (NT) mutations. (B) Example predictions by cmVIP on four variants, one of each type. The correlation matrices at the top show how similar the replicates of each pair are (reference gene self-correlation, reference–variant cross-correlation, and variant self-correlation). The correlation matrix colors represent the correlation values in the same color scale as in D. The boxplots below the matrices show the distribution of median values of the matrices’ rows (self-correlation) and columns (cross-correlation). (C) Sparkler plots display the magnitude and directionality of predictions for all variants in a gene set. The x-axis represents the negative log p-value of the impact test (the larger the more impactful), and the y-axis represents the log p-value of the directionality test polarized by the result of the strength test. All variants for these genes are displayed, but only a few are annotated to aid visualization. All the plots and annotations can be queried at full scale in the interactive website: http://broad.io/cmvip. (D) Correlation matrices for the groups of variants presented in C, together with the corresponding reference alleles.

Citation

Juan C. Caicedo, John Arevalo, Federica Piccioni, Mark-Anthony Bray, Cathy L. Hartland, Xiaoyun Wu, Angela N. Brooks, Alice H. Berger, Jesse S. Boehm, Anne E. Carpenter, Shantanu Singh. Cell Painting predicts impact of lung cancer variants. Molecular Biology of the Cell 33, ar49 (2022). https://doi.org/10.1091/mbc.E21-11-0538

Back to the plate

Figure 1 from Virtual screening for small-molecule pathway regulators by image-profile matching
Figure 1.

2022, Cell Systems. Well D1.

Virtual screening for small-molecule pathway regulators by image-profile matching

Mohammad H. Rohban, Ashley M. Fuller, Ceryl Tan, Jonathan T. Goldstein, Deepsing Syangtan, Amos Gutnick, Ann DeVine, Madhura P. Nijsure, Megan Rigby, Joshua R. Sacher, Steven M. Corsello, Grace B. Peppler, Marta Bogaczynska, Andrew Boghossian, Gabrielle E. Ciotti, Allison T. Hands, Aroonroj Mekareeya, Minh Doan, Jennifer P. Gale, Rik Derynck, Thomas Turbyville, Joel D. Boerckel, Shantanu Singh, Laura L. Kiessling, Thomas L. Schwarz, Xaralabos Varelas, Florence F. Wagner, Ran Kafri, T.S. Karin Eisinger-Mathason, Anne E. Carpenter

Read the paper

Caption

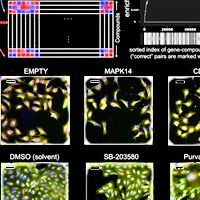
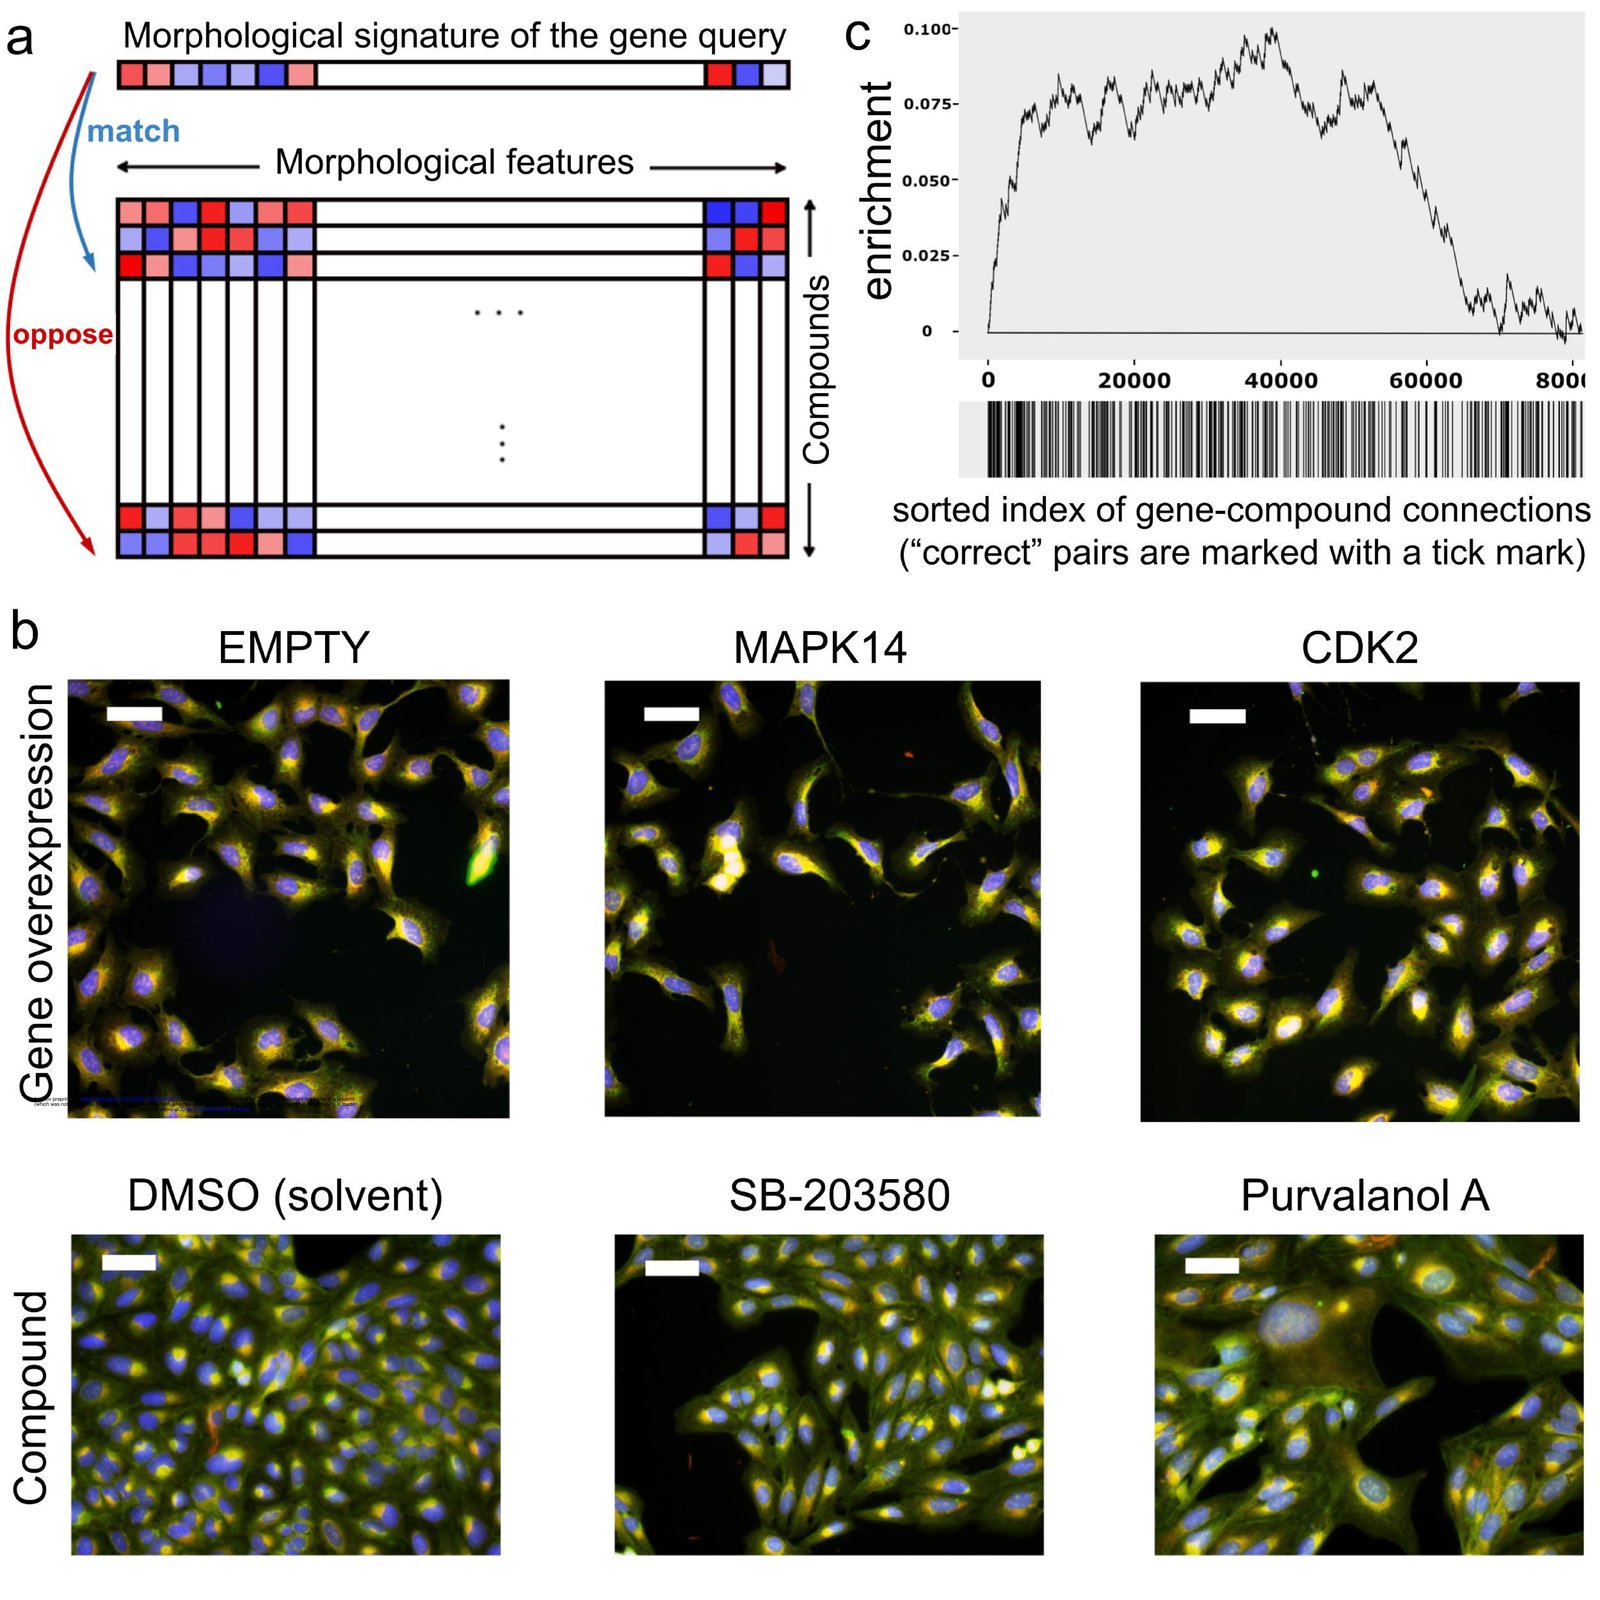
Image profile-based drug discovery offers efficient, virtual screening for pathway modulators. a) If an overexpressed gene changes the morphology of cells, its image-based profile can be used as a query in a database of small molecule profiles, looking for those that match (positively correlate) or oppose (negatively correlate). b) Cell Painting images for two positive control gene-compound matches that yield observable morphological phenotypes (not all are expected to). EMPTY and DMSO are the negative controls in the gene overexpression and compound experiments, respectively; they differ in confluency and image acquisition conditions. The phenotype of p38α (MAPK14) overexpression matches (correlates to) that of SB-203580, a known p38 inhibitor; in both, elongated cells are over-represented. The phenotype of CDK2 overexpression (small cells) negatively correlates to that of purvalanol-a, a known CDK inhibitor, which induces an opposite phenotype (huge cells). Scale bars= 60 μm. c) Enrichment plot of all gene-compound pairs sorted based on their absolute profile correlation. Starting from the left, the curve rises a unit if the gene-compound pair is a known/annotated connection, and goes down a unit otherwise. The units are normalized to the number of possible known connections, so the maximum height is one and ends in zero. The steep increase of the curve indicates enrichment of correct connections towards the top of the rank-ordered list of pairs.

Citation

Mohammad H. Rohban, Ashley M. Fuller, Ceryl Tan, Jonathan T. Goldstein, Deepsing Syangtan, Amos Gutnick, Ann DeVine, Madhura P. Nijsure, Megan Rigby, Joshua R. Sacher, Steven M. Corsello, Grace B. Peppler, Marta Bogaczynska, Andrew Boghossian, Gabrielle E. Ciotti, Allison T. Hands, Aroonroj Mekareeya, Minh Doan, Jennifer P. Gale, Rik Derynck, Thomas Turbyville, Joel D. Boerckel, Shantanu Singh, Laura L. Kiessling, Thomas L. Schwarz, Xaralabos Varelas, Florence F. Wagner, Ran Kafri, T. S. Karin Eisinger-Mathason, Anne E. Carpenter. Virtual screening for small-molecule pathway regulators by image-profile matching. Cell Systems 13, 724-736.e9 (2022). https://doi.org/10.1016/j.cels.2022.08.003

Back to the plate

Figure 1 from In vitro neutrophil migration is associated with inhaled corticosteroid treatment and serum cytokines in pediatric asthma
Figure 1.

2022, Frontiers in Pharmacology. Well D2.

In vitro neutrophil migration is associated with inhaled corticosteroid treatment and serum cytokines in pediatric asthma

Solveig Lemmel, Markus Weckmann, Anna Wohlers, Adan Chari Jirmo, Ruth Grychtol, Isabell Ricklefs, Gyde Nissen, Anna Bachmann, Shantanu Singh, Juan Caicedo, Thomas Bahmer, Gesine Hansen, Erika Von Mutius, Klaus F. Rabe, Oliver Fuchs, Anna-Maria Dittrich, Bianca Schaub, Christine Happle, Anne E. Carpenter, Matthias Volkmar Kopp, Tim Becker, the ALLIANCE Study Group as part of the German Centre for Lung Research (DZL)

Read the paper

Caption

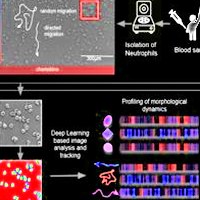
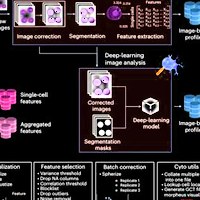
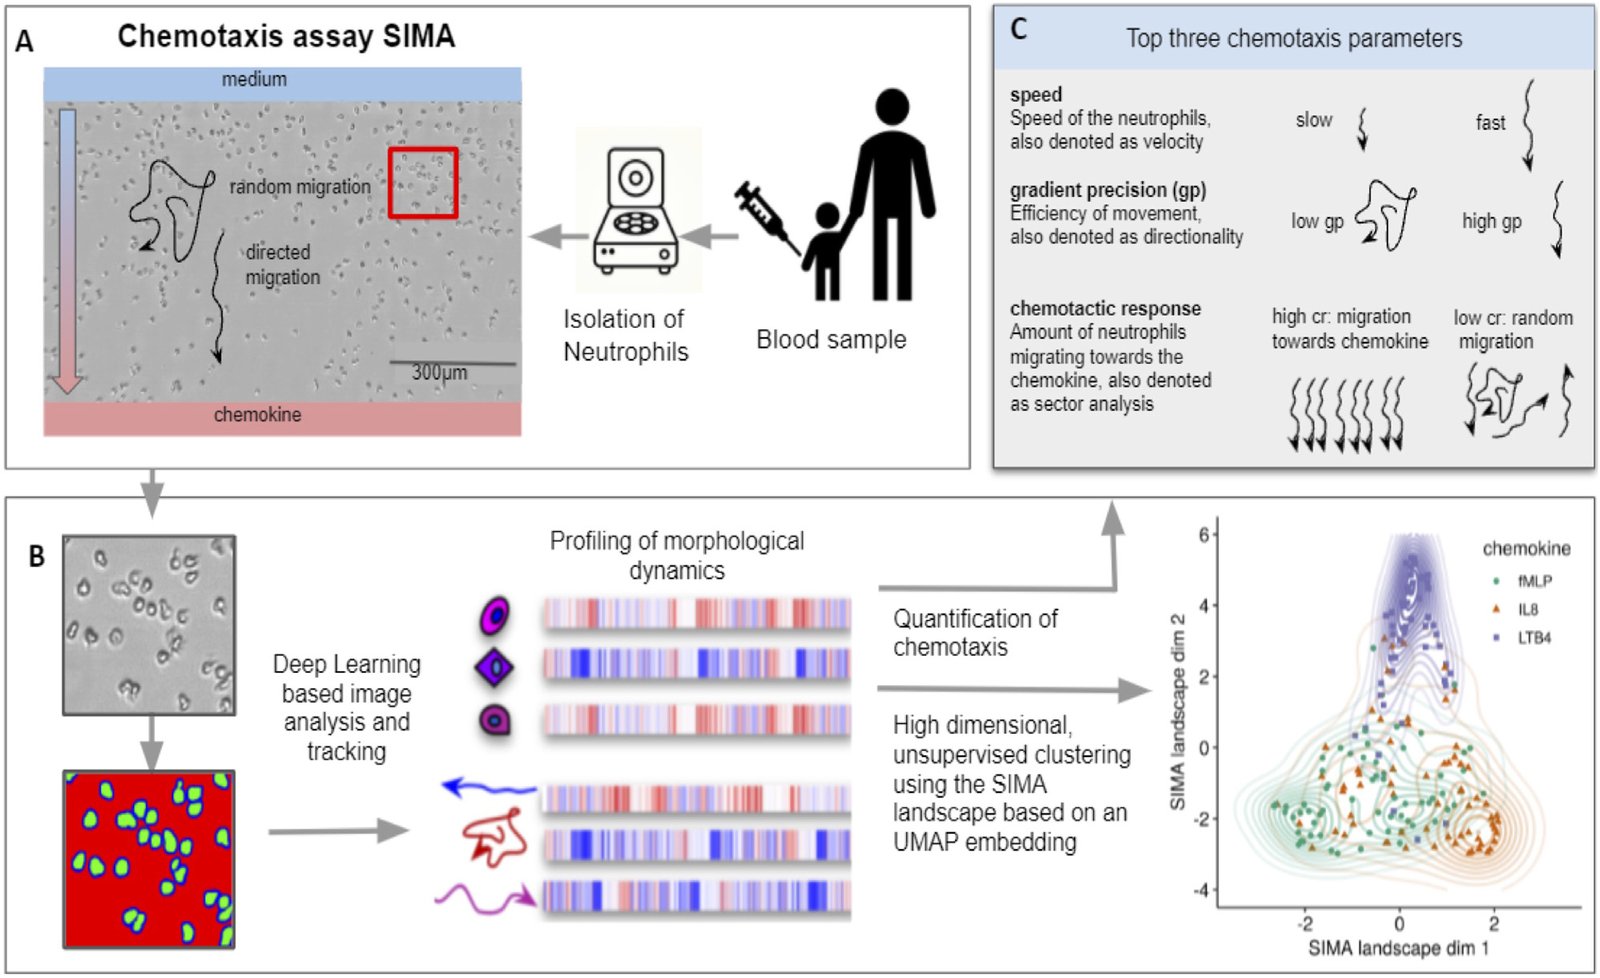
Pipeline of the SiMA chemotaxis analysis. (A) Neutrophils are isolated from a blood sample and chemotaxis is induced using a SiMA assay. For each patient, the migration towards IL8, fMLP and LTB4 is recorded using time lapse microscopy. (B) A Deep Learning based image segmentation (UNet model) is used to identify and track neutrophil granulocytes. For each experiment, single-cell and single-trajectory profiles are created using CellProfiler and MigrationmineR, describing each neutrophil with a total of 25 features (after feature selection). These features are aggregated on an experiment level and used for quantification of chemotaxis. (C) The most telling and interpretable migration parameters are speed, chemotactic response and the gradient precision. A multidimensional analysis is performed using the complete feature set, which is projected into a two dimensional SiMA landscape using the UMAP algorithm for dimension reduction.

Citation

Solveig Lemmel, Markus Weckmann, Anna Wohlers, Adan Chari Jirmo, Ruth Grychtol, Isabell Ricklefs, Gyde Nissen, Anna Bachmann, Shantanu Singh, Juan Caicedo, Thomas Bahmer, Gesine Hansen, Erika Von Mutius, Klaus F. Rabe, Oliver Fuchs, Anna-Maria Dittrich, Bianca Schaub, Christine Happle, Anne E. Carpenter, Matthias Volkmar Kopp, Tim Becker, the ALLIANCE Study Group as part of the German Centre for Lung Research (DZL). In vitro neutrophil migration is associated with inhaled corticosteroid treatment and serum cytokines in pediatric asthma. Frontiers in Pharmacology 13, 1021317 (2022). https://doi.org/10.3389/fphar.2022.1021317

Back to the plate

Figure 1 from Morphology and gene expression profiling provide complementary information for mapping cell state
Figure 1.

2022, Cell Systems. Well D3.

Morphology and gene expression profiling provide complementary information for mapping cell state

Gregory P. Way, Ted Natoli, Adeniyi Adeboye, Lev Litichevskiy, Andrew Yang, Xiaodong Lu, Juan C. Caicedo, Beth A. Cimini, Kyle Karhohs, David J. Logan, Mohammad H. Rohban, Maria Kost-Alimova, Kate Hartland, Michael Bornholdt, Srinivas Niranj Chandrasekaran, Marzieh Haghighi, Erin Weisbart, Shantanu Singh, Aravind Subramanian, Anne E. Carpenter

Read the paper

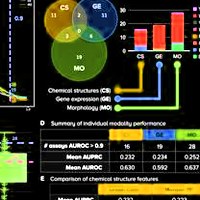
Caption

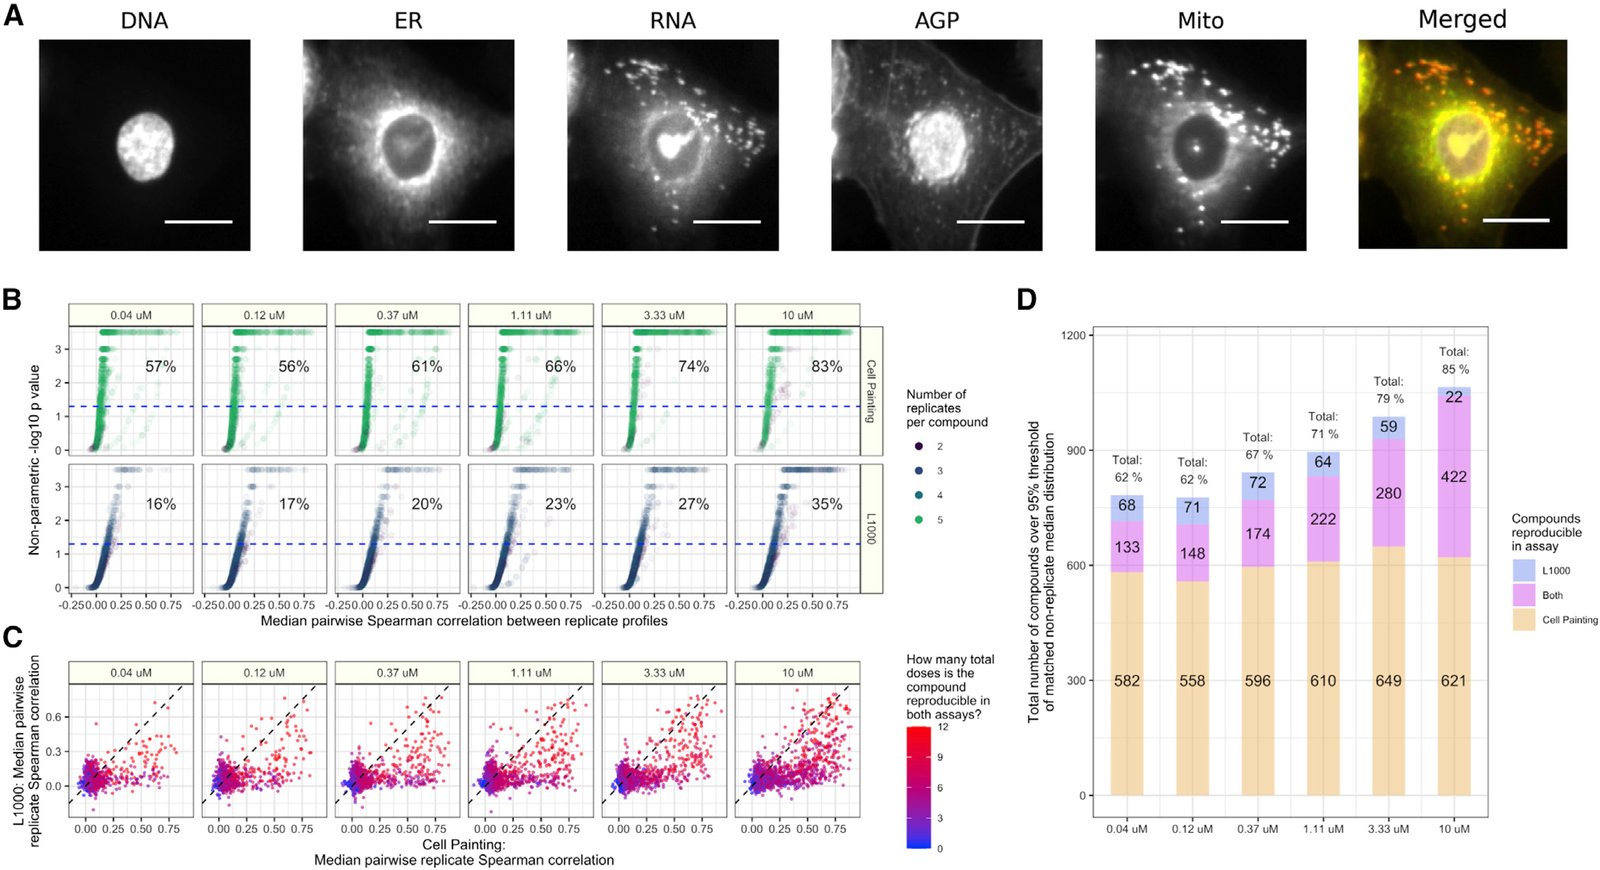
Cell Painting and L1000 data provide complementary measurements of compound perturbations across doses. (A) An example Cell Painting image of a single A549 lung cancer cell measured across five channels. We show a merged representation as well. ER, endoplasmic reticulum; Mito, mitochondria; AGP, actin, Golgi, plasma membrane. Scale bar is 20 μm. (B) The percent replicating metric measures the percentage of profiles that correlate with each other to a level higher than a carefully matched and randomly sampled null distribution. See methods for full details about sampling and data processing. The dotted blue line indicates the 95th percentile of the matched non-replicate distribution. (C) Median pairwise replicate Spearman correlations between profiles measured by the L1000 assay (y axis) and Cell Painting assay (x axis). The dotted black line is the line y = x, so anything above is measured with a higher replicate correlation in L1000 and vice versa. (D) The L1000 and Cell Painting assays reproducibly measure a complementary set of compound perturbations. The three numbers represent (from top to bottom) the number of compounds unique to L1000, the number of compounds captured in both assays, and the number of compounds unique to Cell Painting that have median pairwise replicate correlations above the randomized non-replicate correlation threshold.

Citation

Gregory P. Way, Ted Natoli, Adeniyi Adeboye, Lev Litichevskiy, Andrew Yang, Xiaodong Lu, Juan C. Caicedo, Beth A. Cimini, Kyle Karhohs, David J. Logan, Mohammad H. Rohban, Maria Kost-Alimova, Kate Hartland, Michael Bornholdt, Srinivas Niranj Chandrasekaran, Marzieh Haghighi, Erin Weisbart, Shantanu Singh, Aravind Subramanian, Anne E. Carpenter. Morphology and gene expression profiling provide complementary information for mapping cell state. Cell Systems 13, 911-923.e9 (2022). https://doi.org/10.1016/j.cels.2022.10.001

Back to the plate

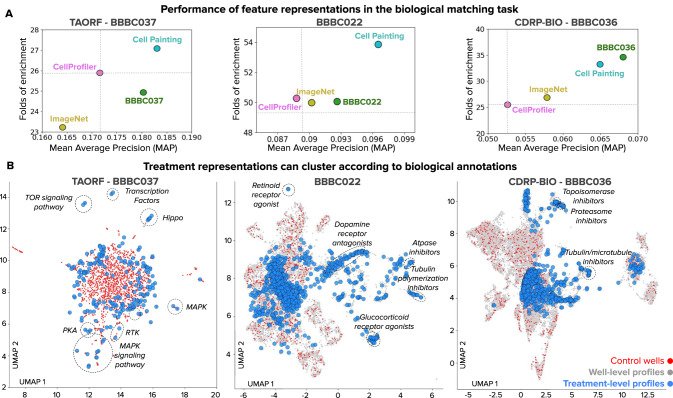
Figure 1 from High-dimensional gene expression and morphology profiles of cells across 28,000 genetic and chemical perturbations
Figure 1.

2022, Nature Methods. Well D4.

High-dimensional gene expression and morphology profiles of cells across 28,000 genetic and chemical perturbations

Marzieh Haghighi, Juan C. Caicedo, Beth A. Cimini, Anne E. Carpenter, Shantanu Singh

Read the paper

Caption

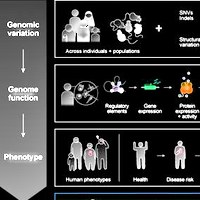
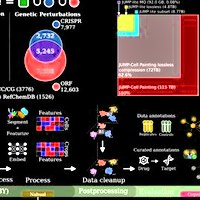
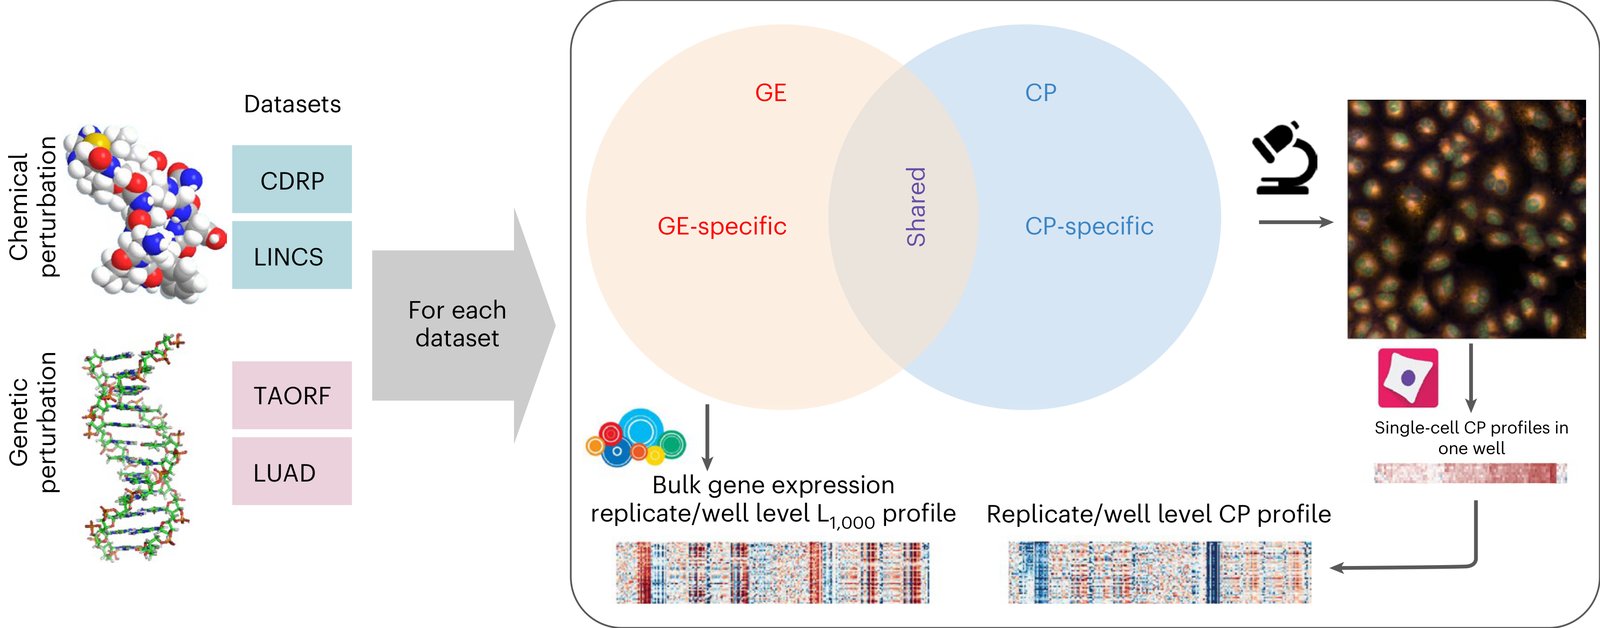
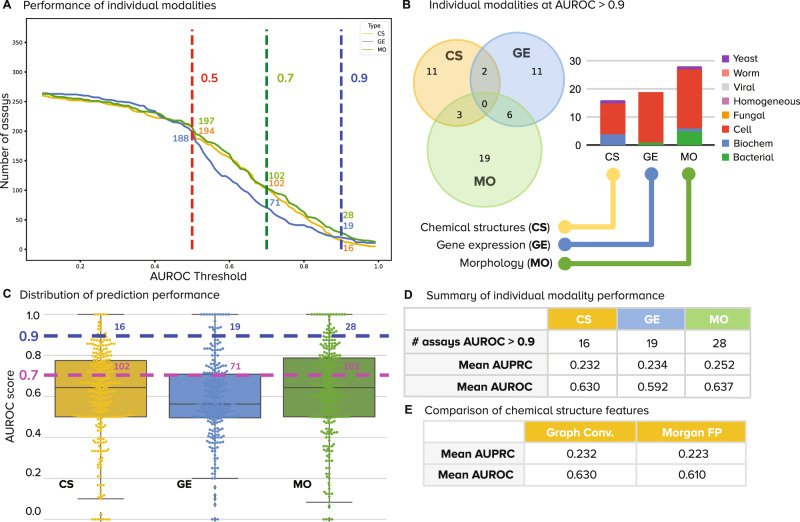
Multimodal datasets overview. Multimodal genetic and chemical perturbation datasets are valuable for many applications. For each dataset, CP and GE L1000 assays were used to collect morphological and GE representations (profiles), respectively. The datasets are described in Supplementary 1. Chemical structure by G. J. Owns, distributed under a CC0 3.0 license. DNA structure by R. Wheeler, distributed under a CC BY-SA 3.0 license.

Citation

Marzieh Haghighi, Juan C. Caicedo, Beth A. Cimini, Anne E. Carpenter, Shantanu Singh. High-dimensional gene expression and morphology profiles of cells across 28,000 genetic and chemical perturbations. Nature Methods 19, 1550-1557 (2022). https://doi.org/10.1038/s41592-022-01667-0

Back to the plate

Image drawn for this tribute, not from the paper
Drawn for this tribute.

2022, Pacific Symposium on Biocomputing (PSB 2022). Well D5.

Image-based profiling: a powerful and challenging new data type

Gregory P. Way, Hannah Spitzer, Philip Burnham, Arjun Raj, Fabian Theis, Shantanu Singh, Anne E. Carpenter

Read the paper

This paper has no figures.

Citation

Gregory P. Way, Hannah Spitzer, Philip Burnham, Arjun Raj, Fabian Theis, Shantanu Singh, Anne E. Carpenter. Image-based profiling: a powerful and challenging new data type. Pacific Symposium on Biocomputing (PSB 2022) 27, 407-411 (2022). https://doi.org/10.1142/9789811250477_0038

Back to the plate

2023

Figure 2 from Interpreting Image‐based Profiles using Similarity Clustering and Single‐Cell Visualization
Figure 2.

2023, Current Protocols. Well D6.

Interpreting Image‐based Profiles using Similarity Clustering and Single‐Cell Visualization

Fernanda Garcia-Fossa, Mario Costa Cruz, Marzieh Haghighi, Marcelo Bispo de Jesus, Shantanu Singh, Anne E. Carpenter, Beth A. Cimini

Read the paper

Caption

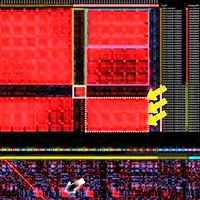
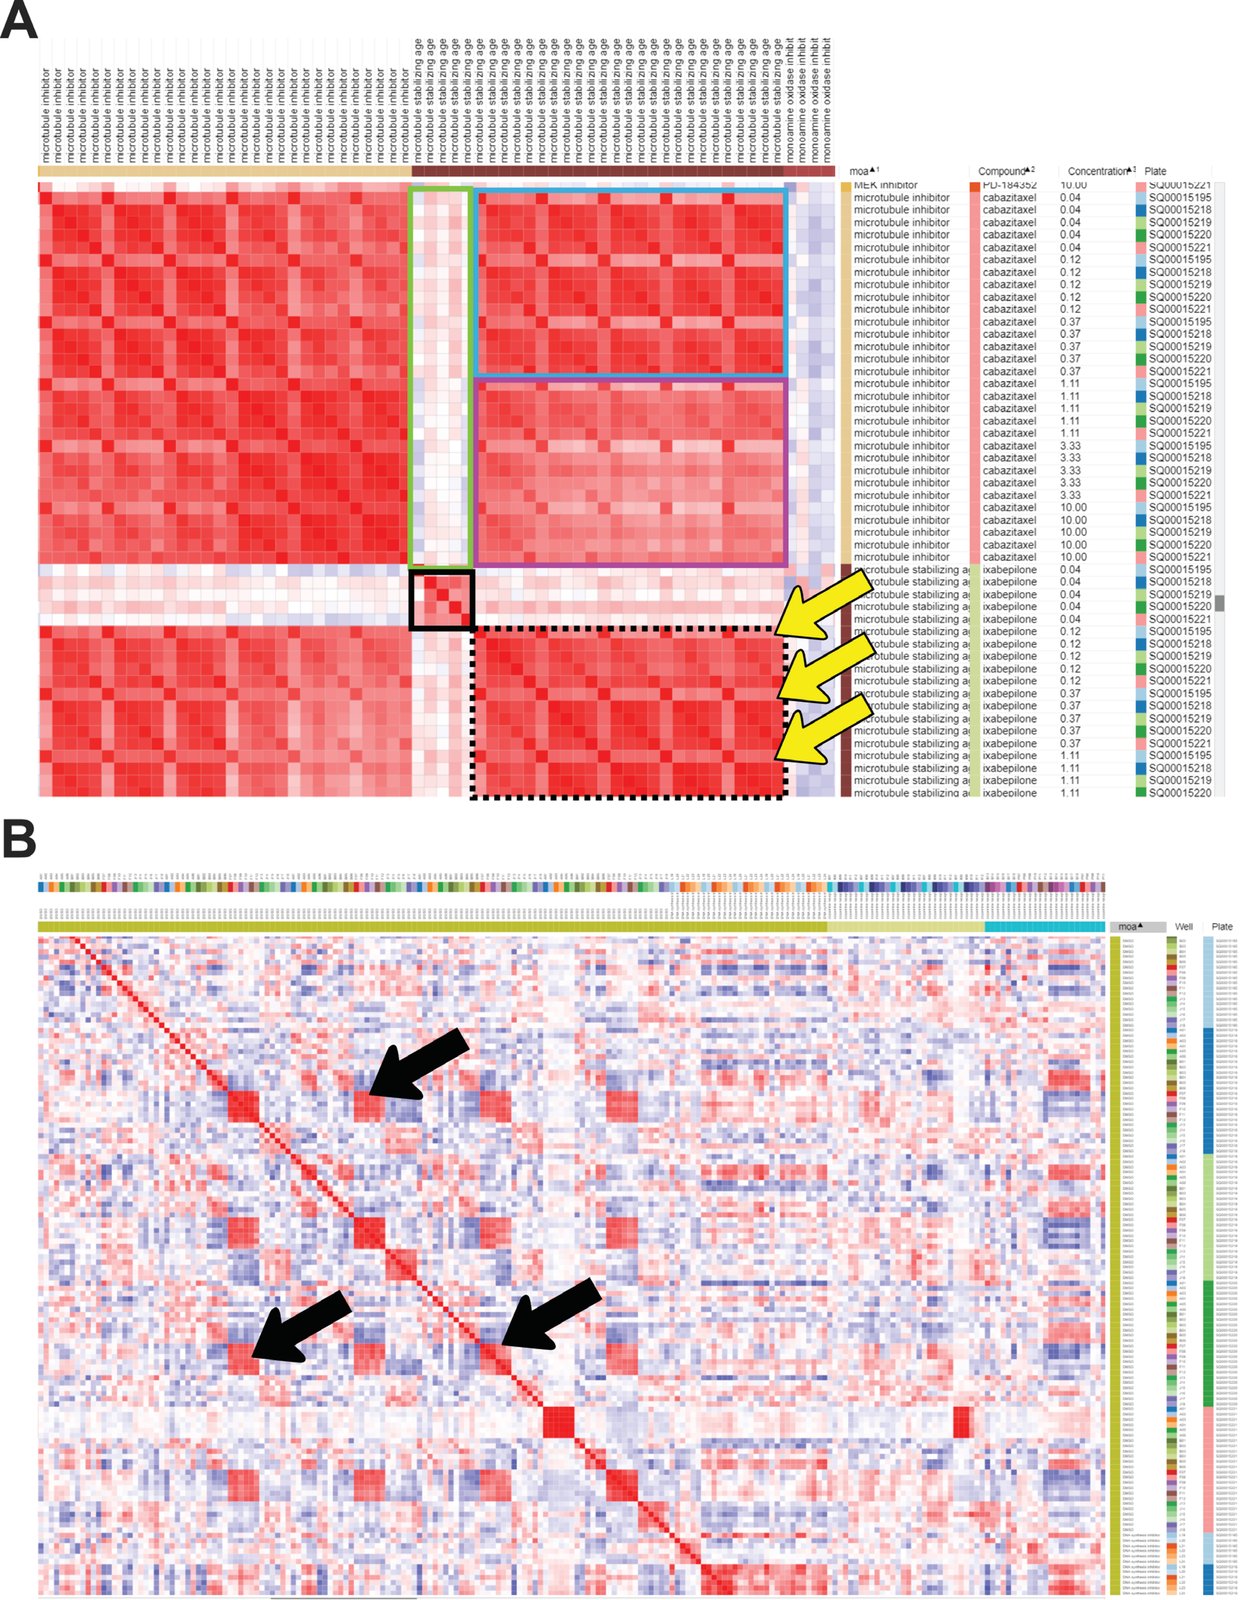
Similarity matrix generated in Morpheus. Columns were sorted by MOA, then Compound, then Concentration. (A) A subset of the similarity matrix showing the MOAs “Microtubule inhibitor” and “Microtubule stabilizing agent”. The top left and bottom right large red blocks show similarity of various doses on various plates within the same MOA class; the blocks on the top right and lower left are identical except for rotation, and show the similarity across classes. The small solid black box in the center shows the lowest dose of microtubule-stabilizing agent clusters well across replicates; its relatively poor correlation with the tightly clustered replicates at higher doses (black-dashed box) or any concentrations of microtubule inhibitor (green box) shows it might be below the effective dose of this drug. Higher doses of a microtubule-stabilizing agent cluster well within and across doses, though a subtle recurring pattern within this block (highlighted by yellow arrows) indicates that one of the five replicates shows a somewhat different profile than the other four, indicating a possible batch effect or technical anomaly. The effective concentration of a drug is highlighted by the lowest dose of ixabepilone clustering together (black box) but having weak correlations with the highest doses of ixabepilone. The higher doses of the microtubule-stabilizing agent are extremely similar to low concentrations of microtubule inhibitor (blue box) but less similar to higher concentrations of microtubule inhibitor (purple box). (B) Negative control (DMSO) correlation pattern, zoom out view of the similarity matrix. Black arrows highlight artifacts from plate-layout effects; treatments plated in the same or very similar well positions still can show significant similarity even after normalization. This can be alleviated at the experimental level by scrambling positions across plates and/or plating the same treatment in multiple positions spread across an individual plate.

Citation

Fernanda Garcia-Fossa, Mario Costa Cruz, Marzieh Haghighi, Marcelo Bispo de Jesus, Shantanu Singh, Anne E. Carpenter, Beth A. Cimini. Interpreting Image-based Profiles using Similarity Clustering and Single-Cell Visualization. Current Protocols 3, e713 (2023). https://doi.org/10.1002/cpz1.713

Back to the plate

Figure 1 from Reference compounds for characterizing cellular injury in high-content cellular morphology assays
Figure 1.

2023, Nature Communications. Well D7.

Reference compounds for characterizing cellular injury in high-content cellular morphology assays

Jayme L. Dahlin, Bruce K. Hua, Beth E. Zucconi, Shawn D. Nelson Jr, Shantanu Singh, Anne E. Carpenter, Jonathan H. Shrimp, Evelyne Lima-Fernandes, Mathias J. Wawer, Lawrence P. W. Chung, Ayushi Agrawal, Mary O’Reilly, Dalia Barsyte-Lovejoy, Magdalena Szewczyk, Fengling Li, Parnian Lak, Matthew Cuellar, Philip A. Cole, Jordan L. Meier, Tim Thomas, Jonathan B. Baell, Peter J. Brown, Michael A. Walters, Paul A. Clemons, Stuart L. Schreiber, Bridget K. Wagner

Read the paper

Caption

Characterization of cell injury compounds using cell painting. Compounds associated with cell injury were each profiled by cell painting (CP) after 24 h of compound exposure in U-2 OS cells. a Active CP compounds (by Mahalanobis distance) are enriched for decreased cell number in the Molecular Libraries Initiative (MLI) dataset25. Red highlight: compounds with the highest CP activity generally have the lowest relative cell numbers. b Cell injury compounds cause distinct CP phenotypes. Left: PCA plots showing unsupervised hierarchical clustering of CP phenotypes into nine clusters (some annotated when grossly associated with a compound category). Compounds causing gross cellular injury that could not be grouped into a more distinct MoA occupied with the largest area in the PCA plot. Right: reduced feature summaries for each cluster (all compound concentrations); rad dist, radial distribution. c “Dot plot” summary of cell injury compound categories by each CP cluster. The dot locations denote cluster identity, the dot sizes denote abundance within each compound subset, and the colors denote average activity score for all compounds in the subset. d The CP clusters of cell injury compounds correlate with cell number. Cluster 9, which is most associated with gross cell injury, has the highest activity score and lowest relative cell number. The cut-off is 3 SD from the mean of DMSO-treated wells using the CP activity (Mahalanobis distances). e Compounds from the MLI dataset with high correlation (MLI-HC) to gross injury signature (cluster 9) are active upon re-testing (red), whereas compounds with no correlation to cluster 9 were not active upon re-testing (blue). Inset: heatmap and dendrogram shows pairwise correlation coefficients between each MLI CP compound profile and each of the nine clusters (red arrowhead, enrichment of cluster 9). f Select CP profiles of cellular injury compounds, demonstrating several different CP phenotypes of cell injury compounds. Rainbow plots denote assigned cluster at each compound concentration; arrow indicates compound concentration of representative image. For rainbow plots, note that phenotypic trajectories do not have to progress through each cluster before reaching the cluster 9 “gross injury” phenotype (dotted lines). Image scales: 50 μm. Data are mean ± SD of four intra-run technical replicates each performed on separate microplates. Source data are provided as a Source Data file.

Citation

Jayme L. Dahlin, Bruce K. Hua, Beth E. Zucconi, Shawn D. Nelson Jr, Shantanu Singh, Anne E. Carpenter, Jonathan H. Shrimp, Evelyne Lima-Fernandes, Mathias J. Wawer, Lawrence P. W. Chung, Ayushi Agrawal, Mary O’Reilly, Dalia Barsyte-Lovejoy, Magdalena Szewczyk, Fengling Li, Parnian Lak, Matthew Cuellar, Philip A. Cole, Jordan L. Meier, Tim Thomas, Jonathan B. Baell, Peter J. Brown, Michael A. Walters, Paul A. Clemons, Stuart L. Schreiber, Bridget K. Wagner. Reference compounds for characterizing cellular injury in high-content cellular morphology assays. Nature Communications 14, 1364 (2023). https://doi.org/10.1038/s41467-023-36829-x

Back to the plate

Figure 2 from Predicting compound activity from phenotypic profiles and chemical structures
Figure 2.

2023, Nature Communications. Well D8.

Predicting compound activity from phenotypic profiles and chemical structures

Nikita Moshkov, Tim Becker, Kevin Yang, Peter Horvath, Vlado Dancik, Bridget K. Wagner, Paul A. Clemons, Shantanu Singh, Anne E. Carpenter, Juan C. Caicedo

Read the paper

Caption

Number of assays that can be accurately predicted using single profiling modalities. All reported numbers are the median result of the five-fold cross-validation experiments run in the dataset. A Performance of individual modalities measured as the number of assays (vertical axis) predicted with AUROC above a certain threshold (horizontal axis). With higher AUROC thresholds, the number of assays that can be predicted decreases for all profiling modalities. We define accurate assays as those with AUROC greater than 0.9 (dashed vertical line in blue). B The Venn diagrams on the right show the number of accurate assays (median AUROC > 0.9) that are in common or unique to each profiling modality. The bar plot shows the distribution of assay types correctly predicted by single profiling modalities. C Distribution of performance of data modalities over all assays. Points are the median AUROC scores of n = 270 assays. Box plot elements: center line, median; box limits, upper and lower quartiles; whiskers, 1.5x interquartile range; points, all points presented using a swarmplot. D Number of assays well predicted (median AUROC > 0.9) by each individual modality (first row is the same as in Fig. 3B). E Performance of chemical structure features on the assay prediction task: graph convolutions are learned representations, while Morgan Fingerprints are classical representations. CS Chemical Structure, GE Gene Expression, MO Morphology, AUROC Area under the receiver operating characteristic, AUPRC Area under the precision recall curve, Conv convolutions, FP fingerprints.

Citation

Nikita Moshkov, Tim Becker, Kevin Yang, Peter Horvath, Vlado Dancik, Bridget K. Wagner, Paul A. Clemons, Shantanu Singh, Anne E. Carpenter, Juan C. Caicedo. Predicting compound activity from phenotypic profiles and chemical structures. Nature Communications 14, 1967 (2023). https://doi.org/10.1038/s41467-023-37570-1

Back to the plate

Figure 1 from FALCON systematically interrogates free fatty acid biology and identifies a novel mediator of lipotoxicity
Figure 1.

2023, Cell Metabolism. Well D9.

FALCON systematically interrogates free fatty acid biology and identifies a novel mediator of lipotoxicity

Nicolas Wieder, Juliana Coraor Fried, Choah Kim, Eriene-Heidi Sidhom, Matthew R. Brown, Jamie L. Marshall, Carlos Arevalo, Moran Dvela-Levitt, Maria Kost-Alimova, Jonas Sieber, Katlyn R. Gabriel, Julian Pacheco, Clary Clish, Hamdah Shafqat Abbasi, Shantanu Singh, Justine C. Rutter, Martine Therrien, Haejin Yoon, Zon Weng Lai, Aaron Baublis, Renuka Subramanian, Ranjan Devkota, Jonnell Small, Vedagopuram Sreekanth, Myeonghoon Han, Donghyun Lim, Anne E. Carpenter, Jason Flannick, Hilary Finucane, Marcia C. Haigis, Melina Claussnitzer, Eric Sheu, Beth Stevens, Bridget K. Wagner, Amit Choudhary, Jillian L. Shaw, Juan Lorenzo Pablo, Anna Greka

Read the paper

Caption

FALCON, a multiplexed platform for the systematic interrogation of structurally diverse FFAs, defines 5 FFA clusters. (A) Analysis workflow for FALCON. (B) Schematic of triacylglyceride (TAG) synthesis from FFAs. Shown here are the monoacylglycerol (top) and the glycerol-3-phosphate pathway (bottom). For simplicity, the acylation of dihydroxyacetone phosphate is not shown. (C) Qualitative correlation of structural features (number of C atoms, number of double bonds) of externally applied FFAs from the library (x axis) versus structural features of endogenous TAGs (y axis) measured by lipidomics. Distinct TAG profiles were detected in cells treated with SFAs, MUFAs, or PUFAs. (D) Five FFA clusters (c1–c5) were identified after hierarchical clustering of transcriptomic profiles derived from exposure to each of 61 FFAs (STAR Methods). (E) Cell Painting analysis of immunofluorescence images from cells exposed to each of 61 FFAs (STAR Methods) independently clustered together the FFAs transcriptomically assigned to c2 and separately the FFAs assigned to c5.

Citation

Nicolas Wieder, Juliana Coraor Fried, Choah Kim, Eriene-Heidi Sidhom, Matthew R. Brown, Jamie L. Marshall, Carlos Arevalo, Moran Dvela-Levitt, Maria Kost-Alimova, Jonas Sieber, Katlyn R. Gabriel, Julian Pacheco, Clary Clish, Hamdah Shafqat Abbasi, Shantanu Singh, Justine C. Rutter, Martine Therrien, Haejin Yoon, Zon Weng Lai, Aaron Baublis, Renuka Subramanian, Ranjan Devkota, Jonnell Small, Vedagopuram Sreekanth, Myeonghoon Han, Donghyun Lim, Anne E. Carpenter, Jason Flannick, Hilary Finucane, Marcia C. Haigis, Melina Claussnitzer, Eric Sheu, Beth Stevens, Bridget K. Wagner, Amit Choudhary, Jillian L. Shaw, Juan Lorenzo Pablo, Anna Greka. FALCON systematically interrogates free fatty acid biology and identifies a novel mediator of lipotoxicity. Cell Metabolism 35, 887-905.e11 (2023). https://doi.org/10.1016/j.cmet.2023.03.018

Back to the plate

Figure 2 from Predicting reprogramming-related gene expression from cell morphology in human induced pluripotent stem cells
Figure 2.

2023, Molecular Biology of the Cell. Well D10.

Predicting reprogramming-related gene expression from cell morphology in human induced pluripotent stem cells

Takashi Wakui, Mitsuru Negishi, Yuta Murakami, Shunsuke Tominaga, Yasushi Shiraishi, Anne E. Carpenter, Shantanu Singh, Hideo Segawa

Read the paper

Caption

Gene expression prediction pipeline. We split iPSC phase-contrast images of a sample into patches of 160 × 160 pixels (72 μm) each, extracted feature maps using the VQ-VAE encoder, and integrated the maps into a feature vector. We constructed 218 SVR models corresponding to the 218 target genes. Np: Number of patches, Ni: Number of images.

Citation

Takashi Wakui, Mitsuru Negishi, Yuta Murakami, Shunsuke Tominaga, Yasushi Shiraishi, Anne E. Carpenter, Shantanu Singh, Hideo Segawa. Predicting reprogramming-related gene expression from cell morphology in human induced pluripotent stem cells. Molecular Biology of the Cell 34, ar45 (2023). https://doi.org/10.1091/mbc.E22-06-0215

Back to the plate

Figure 2 from Optimizing the Cell Painting assay for image-based profiling
Figure 2. This image is part of the figure, and the caption describes the whole figure.

2023, Nature Protocols. Well D11.

Optimizing the Cell Painting assay for image-based profiling

Beth A. Cimini, Srinivas Niranj Chandrasekaran, Maria Kost-Alimova, Lisa Miller, Amy Goodale, Briana Fritchman, Patrick Byrne, Sakshi Garg, Nasim Jamali, David J. Logan, John B. Concannon, Charles-Hugues Lardeau, Elizabeth Mouchet, Shantanu Singh, Hamdah Shafqat Abbasi, Peter Aspesi Jr, Justin D. Boyd, Tamara Gilbert, David Gnutt, Santosh Hariharan, Desiree Hernandez, Gisela Hormel, Karolina Juhani, Michelle Melanson, Lewis H. Mervin, Tiziana Monteverde, James E. Pilling, Adam Skepner, Susanne E. Swalley, Anita Vrcic, Erin Weisbart, Guy Williams, Shan Yu, Bolek Zapiec, Anne E. Carpenter

Read the paper

Caption

Plate maps used for assay-optimization experiments. a, The JUMP-MOA compound plate map: unlabeled wells are dimethyl sulfoxide only; all other wells are labeled to show distribution of MOA classes across the entire plate. A version of this figure grouped by compound rather than MOA is available as Extended Data Fig. 1. b, The JUMP-Target plate maps. Black wells contain negative control treatments, whereas gray wells are untreated; other sets of control treatments were selected to provide sets of diverse pairs of positive controls (purples), provide a match between genes and compounds on the basis of previous Cell Painting experiments (teals) or match genes and compounds on the basis of external reports of strong correlations between pairs (yellows). These controls are scattered among treatments hypothesized to affect other genes (reds). See also ref. 17 for more information on the creation of the JUMP-Target plate maps.

Citation

Beth A. Cimini, Srinivas Niranj Chandrasekaran, Maria Kost-Alimova, Lisa Miller, Amy Goodale, Briana Fritchman, Patrick Byrne, Sakshi Garg, Nasim Jamali, David J. Logan, John B. Concannon, Charles-Hugues Lardeau, Elizabeth Mouchet, Shantanu Singh, Hamdah Shafqat Abbasi, Peter Aspesi Jr, Justin D. Boyd, Tamara Gilbert, David Gnutt, Santosh Hariharan, Desiree Hernandez, Gisela Hormel, Karolina Juhani, Michelle Melanson, Lewis H. Mervin, Tiziana Monteverde, James E. Pilling, Adam Skepner, Susanne E. Swalley, Anita Vrcic, Erin Weisbart, Guy Williams, Shan Yu, Bolek Zapiec, Anne E. Carpenter. Optimizing the Cell Painting assay for image-based profiling. Nature Protocols 18, 1981-2013 (2023). https://doi.org/10.1038/s41596-023-00840-9

Back to the plate

Figure 1 from Pseudo-Labeling Enhanced by Privileged Information and Its Application to In Situ Sequencing Images
Figure 1.

2023, International Joint Conference on Artificial Intelligence (IJCAI 2023). Well D12.

Pseudo-Labeling Enhanced by Privileged Information and Its Application to In Situ Sequencing Images

Marzieh Haghighi, Mario C. Cruz, Erin Weisbart, Beth A. Cimini, Avtar Singh, Julia Bauman, Maria E. Lozada, Sanam L. Kavari, James T. Neal, Paul C. Blainey, Anne E. Carpenter, Shantanu Singh

Read the paper

Caption

Schematic representation of PLePI in a teacher-student learning loop. The teacher generates pseudo-labels for Confident samples by confidence thresholding, and for Mediocre samples by fusion of it’s own soft predictions and the evidence provided by the privileged information (ℰPI).

Citation

Marzieh Haghighi, Mario C. Cruz, Erin Weisbart, Beth A. Cimini, Avtar Singh, Julia Bauman, Maria E. Lozada, Sanam L. Kavari, James T. Neal, Paul C. Blainey, Anne E. Carpenter, Shantanu Singh. Pseudo-Labeling Enhanced by Privileged Information and Its Application to In Situ Sequencing Images. International Joint Conference on Artificial Intelligence (IJCAI 2023), 4775-4784 (2023). https://doi.org/10.24963/ijcai.2023/531

Back to the plate

Figure 2 from Integrating inflammatory biomarker analysis and artificial-intelligence-enabled image-based profiling to identify drug targets for intestinal fibrosis
Figure 2.

2023, Cell Chemical Biology. Well E1.

Integrating inflammatory biomarker analysis and artificial-intelligence-enabled image-based profiling to identify drug targets for intestinal fibrosis

Shan Yu, Alexandr A. Kalinin, Maria D. Paraskevopoulou, Marco Maruggi, Jie Cheng, Jie Tang, Ilknur Icke, Yi Luo, Qun Wei, Dan Scheibe, Joel Hunter, Shantanu Singh, Deborah Nguyen, Anne E. Carpenter, Shane R. Horman

Read the paper

Caption

Chemogenomic library screen workflow. (A) The screen was conducted through a process including primary screening, hit confirmation and other orthogonal validation assays. For the primary screen, colonic fibroblasts CCD-18co cells were plated on Day 1, followed by small molecule transfer on Day 2, and 10 ng/mL TNFα stimulation on Day 3. The supernatant samples were collected for the CXCL10 reduction assay and cells were stained with the Cell Painting dyes for the high content imaging assay. Hits from both assays were called and analyzed individually and collectively. (B) CCD-18co cells that were stained with Cell Painting dyes including Hoechst 33342 (nuclei), Concanavalin A-Alexa 488 (ER), SYTO™ 14 (nucleic acid), WGA-Alexa 555 (Golgi), phalloidin-Alexa 568 (cytoskeleton) and MitoTracker Deep Red (mitochondria), and imaged with Operetta CLS. The image on the far left was merged image of all channels. (C) Workflow of cellular compartment segmentation of high content images using Perkin Elmer Harmony software. Nuclei were identified by Hoechst 33342 stain. Cytoplasm was then identified by Concanavalin A-Alexa 488 stain. The border objects were excluded from analysis. Different morphology and intensity properties of each channel were calculated and 860 features were extracted at the well-level. The profiling dataset was then analyzed with a dimensionality reduction method, such as PCA.

Citation

Shan Yu, Alexandr A. Kalinin, Maria D. Paraskevopoulou, Marco Maruggi, Jie Cheng, Jie Tang, Ilknur Icke, Yi Luo, Qun Wei, Dan Scheibe, Joel Hunter, Shantanu Singh, Deborah Nguyen, Anne E. Carpenter, Shane R. Horman. Integrating inflammatory biomarker analysis and artificial-intelligence-enabled image-based profiling to identify drug targets for intestinal fibrosis. Cell Chemical Biology 30, 1169-1182.e8 (2023). https://doi.org/10.1016/j.chembiol.2023.06.014

Back to the plate

Figure 3 from High-content microscopy reveals a morphological signature of bortezomib resistance
Figure 3.

2023, eLife. Well E2.

High-content microscopy reveals a morphological signature of bortezomib resistance

Megan E Kelley, Adi Y Berman, David R Stirling, Beth A Cimini, Yu Han, Shantanu Singh, Anne E Carpenter, Tarun M Kapoor, Gregory P Way

Read the paper

Caption

Cell morphology predicts the bortezomib sensitivity of clones across datasets. Box plots of Bortezomib Signatures for clones in the (A) training, (B) validation, (C) test, and (D) holdout datasets. Plots show values for individual well profiles (points), range (error bars), 25th and 75th percentiles (box boundaries), and median. Dashed vertical black line is Bortezomib Signature = 0, dashed vertical red lines are the 95% confidence interval for Bortezomib Signatures of 1000 random permutations of the data. (E) ROC curves for the performance of the Bortezomib Signature on the indicated dataset (solid line) or its shuffled counterpart (dashed line). Datasets are designated by color: training (magenta), validation (orange), test (teal), and holdout (purple). Colored points are the corresponding false positive and true positive rates at the absolute minimum thresholds for each respective dataset. Black dotted line is the identity line where false positive rate = true positive rate. AUROC values reported for data and shuffled data. See Figure 3—source data 1 for breakdown of profiles and experiments per dataset.

Citation

Megan E. Kelley, Adi Y. Berman, David R. Stirling, Beth A. Cimini, Yu Han, Shantanu Singh, Anne E. Carpenter, Tarun M. Kapoor, Gregory P. Way. High-content microscopy reveals a morphological signature of bortezomib resistance. eLife 12, e91362 (2023). https://doi.org/10.7554/eLife.91362

Back to the plate

2024

Figure 1 from MOTIVE: A Drug-Target Interaction Graph For Inductive Link Prediction
Figure 1.

2024, Advances in Neural Information Processing Systems (NeurIPS 2024). Well E3.

MOTIVE: A Drug-Target Interaction Graph For Inductive Link Prediction

John Arevalo, Ellen Su, Anne E. Carpenter, Shantanu Singh

Read the paper

Caption

Schematic of the random split (top row) and cold-source split (bottom row). The leftmost graph illustrates the actual partitioning of the edges, and the three graphs to the right show which nodes and edges are visible to the GNN models during training, validation, and testing. The number of edges in each partition is not representative of our true 70/10/20 ratios. Cold-target split is symmetrical to cold-source split. The model aggregates neighbor features via the message-passing edges (solid lines) and makes predictions on the supervision edges (dotted lines).

Citation

John Arevalo, Ellen Su, Anne E. Carpenter, Shantanu Singh. MOTIVE: A Drug-Target Interaction Graph For Inductive Link Prediction. Advances in Neural Information Processing Systems (NeurIPS 2024) 37, 140320-140333 (2024). https://doi.org/10.52202/079017-4454

Back to the plate

Figure 1 from Image Profiling of Huh-7 Hepatocytes Reveals Distinctive Silver Nanoparticle Effects Over 15 Days
Figure 1.

2024, Chapter 4 of F. Garcia Fóssa, PhD thesis, Universidade Estadual de Campinas. Well E4.

Image Profiling of Huh-7 Hepatocytes Reveals Distinctive Silver Nanoparticle Effects Over 15 Days

Fernanda Garcia-Fossa, Thais Lacerda de Moraes, Shantanu Singh, Anne E. Carpenter, Beth A. Cimini, Marcelo Bispo de Jesus

Caption

UMAP plots of Cell Painting, Live Cell Painting, and Tox Painting panels of Huh-7 cells exposed to AgNP for 1 and 15 days. UMAP representations of each panel labeled by the exposure time (1 or 15 days) in the left panel, and their respective K-means clustering-labeled UMAPs in the right panel, in 2D and 3D. Each point represents the median aggregated data per well in the experiment. UMAPs ran for 50 iterations, so the mean embedding and the standard deviation are represented. The larger dots represent the cells treated with AgNP 100 nm, intermediate points AgNP 40 nm, and the smallest are the negative controls. This assay was performed using n = 5 replicates and repeated twice independently.

Citation

Fernanda Garcia-Fossa, Thais Lacerda de Moraes, Shantanu Singh, Anne E. Carpenter, Beth A. Cimini, Marcelo Bispo de Jesus. Image Profiling of Huh-7 Hepatocytes Reveals Distinctive Silver Nanoparticle Effects Over 15 Days. Chapter 4 of F. Garcia Fóssa, PhD thesis, Universidade Estadual de Campinas, 108-144 (2024).

Back to the plate

Figure 1 from Bringing computation to biology by bridging the last mile
Figure 1.

2024, Nature Cell Biology. Well E5.

Bringing computation to biology by bridging the last mile

Anne E. Carpenter, Shantanu Singh

Read the paper

Caption

Stages of technology-driven acceleration in biological research that involves computational methods.

Citation

Anne E. Carpenter, Shantanu Singh. Bringing computation to biology by bridging the last mile. Nature Cell Biology 26, 5-7 (2024). https://doi.org/10.1038/s41556-023-01286-7

Back to the plate

Figure 1 from High-dimensional phenotyping to define the genetic basis of cellular morphology
Figure 1.

2024, Nature Communications. Well E6.

High-dimensional phenotyping to define the genetic basis of cellular morphology

Matthew Tegtmeyer, Jatin Arora, Samira Asgari, Beth A. Cimini, Ajay Nadig, Emily Peirent, Dhara Liyanage, Gregory P. Way, Erin Weisbart, Aparna Nathan, Tiffany Amariuta, Kevin Eggan, Marzieh Haghighi, Steven A. McCarroll, Luke O’Connor, Anne E. Carpenter, Shantanu Singh, Ralda Nehme, Soumya Raychaudhuri

Read the paper

Caption

Study overview. iPSC lines from 297 donors were expanded, quality-control checked and then subject to both high-throughput imaging with Cell Painting and 30X whole-genome sequencing (WGS). Overall, we imaged 5.1 × 10⁶ cells across all donors and quantified 3418 morphological traits per cell using CellProfiler software. We inferred genetic variants from the WGS data and investigated whether individual morphological traits associated with both rare and common variation.

Citation

Matthew Tegtmeyer, Jatin Arora, Samira Asgari, Beth A. Cimini, Ajay Nadig, Emily Peirent, Dhara Liyanage, Gregory P. Way, Erin Weisbart, Aparna Nathan, Tiffany Amariuta, Kevin Eggan, Marzieh Haghighi, Steven A. McCarroll, Luke O’Connor, Anne E. Carpenter, Shantanu Singh, Ralda Nehme, Soumya Raychaudhuri. High-dimensional phenotyping to define the genetic basis of cellular morphology. Nature Communications 15, 347 (2024). https://doi.org/10.1038/s41467-023-44045-w

Back to the plate

Figure 5 from Insights into Drug Cardiotoxicity from Biological and Chemical Data: The First Public Classifiers for FDA Drug-Induced Cardiotoxicity Rank
Figure 5.

2024, Journal of Chemical Information and Modeling. Well E7.

Insights into Drug Cardiotoxicity from Biological and Chemical Data: The First Public Classifiers for FDA Drug-Induced Cardiotoxicity Rank

Srijit Seal, Ola Spjuth, Layla Hosseini-Gerami, Miguel García-Ortegón, Shantanu Singh, Andreas Bender, Anne E. Carpenter

Read the paper

Caption

Comparison of evaluation metrics of models built in this study with an external test set of 90 compounds evaluated by the (a) AUC-ROC and (b) AUCPR and (c) performance of each model across compounds that are similar (dissimilar) to the training data. The ensemble model in (c) is based on the models built on six data sources listed in the main text, and evaluation is for 90 held-out compounds; results for the ensemble using 11 data sources and 78 held-out compounds are in Supporting Information Figure S3.

Citation

Srijit Seal, Ola Spjuth, Layla Hosseini-Gerami, Miguel García-Ortegón, Shantanu Singh, Andreas Bender, Anne E. Carpenter. Insights into Drug Cardiotoxicity from Biological and Chemical Data: The First Public Classifiers for FDA Drug-Induced Cardiotoxicity Rank. Journal of Chemical Information and Modeling 64, 1172-1186 (2024). https://doi.org/10.1021/acs.jcim.3c01834

Back to the plate

Figure 5 from Learning representations for image-based profiling of perturbations
Figure 5.

2024, Nature Communications. Well E8.

Learning representations for image-based profiling of perturbations

Nikita Moshkov, Michael Bornholdt, Santiago Benoit, Matthew Smith, Claire McQuin, Allen Goodman, Rebecca A. Senft, Yu Han, Mehrtash Babadi, Peter Horvath, Beth A. Cimini, Anne E. Carpenter, Shantanu Singh, Juan C. Caicedo

Read the paper

Caption

Quantitative and qualitative evaluation of feature representations of treatment effects. The evaluation task is biological profile matching (see Fig. 1G). A Performance of feature representations for the three benchmark datasets according to two metrics: Mean Average Precision (MAP) in the x axis and Folds of Enrichment in the y axis (see Methods). Each point indicates the mean of these metrics over all queries using the following feature representations: CellProfiler (pink), a CNN pre-trained on ImageNet (yellow), a CNN trained on the combined set of Cell Painting images (cyan), and a CNN trained on Cell Painting images from the same dataset (green). In all cases, sphering batch-correction was applied on well-level profiles. B 2D UMAP projections of treatment profiles obtained with the Cell Painting CNN (672 features) after batch correction for the three datasets evaluated in this work. The plot includes a projection of well-level profiles (gray points), control wells (red points), and aggregated treatment-level profiles of treatments (blue points). Dashed lines indicate clusters of treatment-level profiles where all or the majority of points share the same biological annotation. Source data is provided as a Source Data file.

Citation

Nikita Moshkov, Michael Bornholdt, Santiago Benoit, Matthew Smith, Claire McQuin, Allen Goodman, Rebecca A. Senft, Yu Han, Mehrtash Babadi, Peter Horvath, Beth A. Cimini, Anne E. Carpenter, Shantanu Singh, Juan C. Caicedo. Learning representations for image-based profiling of perturbations. Nature Communications 15, 1594 (2024). https://doi.org/10.1038/s41467-024-45999-1

Back to the plate

Figure 1 from From pixels to phenotypes: Integrating image-based profiling with cell health data as BioMorph features improves interpretability
Figure 1.

2024, Molecular Biology of the Cell. Well E9.

From pixels to phenotypes: Integrating image-based profiling with cell health data as BioMorph features improves interpretability

Srijit Seal, Jordi Carreras-Puigvert, Shantanu Singh, Anne E. Carpenter, Ola Spjuth, Andreas Bender

Read the paper

Caption

A map of the BioMorph space. A general representation of the hierarchy of levels is shown (with examples) for each BioMorph term that is organised from Cell Painting features (level 5) and containing information on Cell Health (level 3) associated with measurement type (level 2) under an assay type (level 1) associated with Cell process affected (level 4). Further terms in Supplemental Figure S1 with all terms listed in Supplemental Table S1.

Citation

Srijit Seal, Jordi Carreras-Puigvert, Shantanu Singh, Anne E. Carpenter, Ola Spjuth, Andreas Bender. From pixels to phenotypes: Integrating image-based profiling with cell health data as BioMorph features improves interpretability. Molecular Biology of the Cell 35, mr2 (2024). https://doi.org/10.1091/mbc.E23-08-0298

Back to the plate

Figure 3 from Three million images and morphological profiles of cells treated with matched chemical and genetic perturbations
Figure 3.

2024, Nature Methods. Well E10.

Three million images and morphological profiles of cells treated with matched chemical and genetic perturbations

Srinivas Niranj Chandrasekaran, Beth A. Cimini, Amy Goodale, Lisa Miller, Maria Kost-Alimova, Nasim Jamali, John G. Doench, Briana Fritchman, Adam Skepner, Michelle Melanson, Alexandr A. Kalinin, John Arevalo, Marzieh Haghighi, Juan C. Caicedo, Daniel Kuhn, Desiree Hernandez, James Berstler, Hamdah Shafqat-Abbasi, David E. Root, Susanne E. Swalley, Sakshi Garg, Shantanu Singh, Anne E. Carpenter

Read the paper

Caption

Schema of the data generated in the CPJUMP1 experiment. Each rectangular block of replicates (REPLICATE X or REP X) is a 384-well plate of cells perturbed by compounds, CRISPR guides or ORFs and subjected to different experimental conditions. Short and long time points are described in Supplementary Table 1. Plates in the vertical blue and green boxes comprise the primary CPJUMP1 experiment. The other (that is, secondary) experimental conditions are described in the Methods section.

Citation

Srinivas Niranj Chandrasekaran, Beth A. Cimini, Amy Goodale, Lisa Miller, Maria Kost-Alimova, Nasim Jamali, John G. Doench, Briana Fritchman, Adam Skepner, Michelle Melanson, Alexandr A. Kalinin, John Arevalo, Marzieh Haghighi, Juan C. Caicedo, Daniel Kuhn, Desiree Hernandez, James Berstler, Hamdah Shafqat-Abbasi, David E. Root, Susanne E. Swalley, Sakshi Garg, Shantanu Singh, Anne E. Carpenter. Three million images and morphological profiles of cells treated with matched chemical and genetic perturbations. Nature Methods 21, 1114-1121 (2024). https://doi.org/10.1038/s41592-024-02241-6

Back to the plate

Figure 2 from Calibrated prediction of scarce adverse drug reaction labels with conditional neural processes
Figure 2.

2024, bioRxiv. Well E11.

Calibrated prediction of scarce adverse drug reaction labels with conditional neural processes

Miguel Garcia-Ortegon, Srijit Seal, Shantanu Singh, Andreas Bender, Sergio Bacallado

Read the paper

Caption

Calibration curve of CNP and baselines.

Citation

Miguel Garcia-Ortegon, Srijit Seal, Shantanu Singh, Andreas Bender, Sergio Bacallado. Calibrated prediction of scarce adverse drug reaction labels with conditional neural processes. bioRxiv (2024). https://doi.org/10.1101/2024.06.07.598036

Back to the plate

Figure 1 from Step Forward Cross Validation for Bioactivity Prediction: Out of Distribution Validation in Drug Discovery
Figure 1.

2024, bioRxiv. Well E12.

Step Forward Cross Validation for Bioactivity Prediction: Out of Distribution Validation in Drug Discovery

Udit Surya Saha, Michele Vendruscolo, Anne E. Carpenter, Shantanu Singh, Andreas Bender, Srijit Seal

Read the paper

Caption

Workflow for 10-fold step-forward cross-validation (SFCV). The Di dataset block can be sorted via a calculated or experimental molecular property. Here, we used logP.

Citation

Udit Surya Saha, Michele Vendruscolo, Anne E. Carpenter, Shantanu Singh, Andreas Bender, Srijit Seal. Step Forward Cross Validation for Bioactivity Prediction: Out of Distribution Validation in Drug Discovery. bioRxiv (2024). https://doi.org/10.1101/2024.07.02.601740

Back to the plate

Figure 4 from HSPB7 Rescue of a Titin Cardiomyopathy Identified by Morphological Profiling
Figure 4.

2024, Research Square. Well F1.

HSPB7 Rescue of a Titin Cardiomyopathy Identified by Morphological Profiling

Anant Chopra, Ruifan Pei, Elizabeth M. Brydon, Elizabeth Lee, Matthew Hill, Nasim Jamali, Jiangchuan Ye, Carolina Roselli, Carmen Diaz Verdugo, Stephen Fleming, Ling Xiao, Zeina R.A. Sayed, Maria Kost-Alimova, Carla A. Klattenhoff, Sikander Hayat, Anne E. Carpenter, Beth A. Cimini, Shantanu Singh, Patrick T. Ellinor

Read the paper

Caption

Distinctive drivers of cardiomyocyte morphology. (A) Average cell images of CMs. Cells stained with MYOM1, COXIV, beta-tubulin and DAPI for nucleus, scale bar 10μm. (B) Volcano plots for the features that are statistically different from controls (p<=0.05/(num. features)). (C) Bar plots showing the relative percentage distribution of statistically significant features (p<=0.05/(num. features)). (D) Radar plot showing relative sarcomere feature values of perturbations compared to control. (E) Volcano and bar plot showing the statistically significant features that represent TTN-/- and YWHAE-/-. (p<=0.05/(num. features)). (F) Radar plot showing relative feature values vs control in TTN-/- and YWHAE-/- for all features statistically significant (p<=0.05/(num. features)).

Citation

Anant Chopra, Ruifan Pei, Elizabeth M. Brydon, Elizabeth Lee, Matthew Hill, Nasim Jamali, Jiangchuan Ye, Carolina Roselli, Carmen Diaz Verdugo, Stephen Fleming, Ling Xiao, Zeina R. A. Sayed, Maria Kost-Alimova, Carla A. Klattenhoff, Sikander Hayat, Anne E. Carpenter, Beth A. Cimini, Shantanu Singh, Patrick T. Ellinor. HSPB7 Rescue of a Titin Cardiomyopathy Identified by Morphological Profiling. Research Square (2024). https://doi.org/10.21203/rs.3.rs-4558927/v1

Back to the plate

Figure 5 from Evaluating batch correction methods for image-based cell profiling
Figure 5.

2024, Nature Communications. Well F2.

Evaluating batch correction methods for image-based cell profiling

John Arevalo, Ellen Su, Jessica D. Ewald, Robert van Dijk, Anne E. Carpenter, Shantanu Singh

Read the paper

Caption

Evaluation scenario 4. A Quantitative comparison of ten batch correction methods measuring batch effect removal (four batch correction metrics) and conservation of biological variance (six bio-metrics). Metrics are mean aggregated by category. Overall score is the weighted sum of aggregated batch correction and bio-metrics with 0.4 and 0.6 weights respectively. Visualization of integrated data colored by B Compound, C Laboratory, and D Microscope. Left-to-right layout reflects the methods’ descending order of performance. We selected 18 out of 302 compounds with replicates in different well positions to account for position effects that may cause profiles to look similar; the embeddings are the same across B-D but samples treated with compounds other than the selected 18 are not shown in B. Alphanumeric IDs denote positive controls. Source data are provided as a Source Data file.

Citation

John Arevalo, Ellen Su, Jessica D. Ewald, Robert van Dijk, Anne E. Carpenter, Shantanu Singh. Evaluating batch correction methods for image-based cell profiling. Nature Communications 15, 6516 (2024). https://doi.org/10.1038/s41467-024-50613-5

Back to the plate

Table 1 from Cell Painting Gallery: an open resource for image-based profiling
Table 1.

2024, Nature Methods. Well F3.

Cell Painting Gallery: an open resource for image-based profiling

Erin Weisbart, Ankur Kumar, John Arevalo, Anne E. Carpenter, Beth A. Cimini, Shantanu Singh

Read the paper

Caption

Complete datasets available in the Cell Painting Gallery as of publication. Total data size (complete and in-progress datasets) as of January 2024 is 656 TB.

Citation

Erin Weisbart, Ankur Kumar, John Arevalo, Anne E. Carpenter, Beth A. Cimini, Shantanu Singh. Cell Painting Gallery: an open resource for image-based profiling. Nature Methods 21, 1775-1777 (2024). https://doi.org/10.1038/s41592-024-02399-z

Back to the plate

Figure 1 from Deciphering the impact of genomic variation on function
Figure 1.

2024, Nature. Well F4.

Deciphering the impact of genomic variation on function

IGVF Consortium

Read the paper

Caption

Genomic variation influences genome function and phenotype. Genomic variation includes SNVs, indels, and structural variants, which can alter protein-coding sequences or noncoding sequences. Genome function encompasses the cell-type specific activities and interactions among regulatory elements, genes and proteins within molecular networks that underlie cellular phenotypes. Organismal phenotypes include quantitative and binary traits in health and disease.

Citation

IGVF Consortium. Deciphering the impact of genomic variation on function. Nature 633, 47-57 (2024). https://doi.org/10.1038/s41586-024-07510-0

Back to the plate

Figure 2 from Pervasive mislocalization of pathogenic coding variants underlying human disorders
Figure 2.

2024, Cell. Well F5.

Pervasive mislocalization of pathogenic coding variants underlying human disorders

Jessica Lacoste, Marzieh Haghighi, Shahan Haider, Chloe Reno, Zhen-Yuan Lin, Dmitri Segal, Wesley Wei Qian, Xueting Xiong, Tanisha Teelucksingh, Esteban Miglietta, Hamdah Shafqat-Abbasi, Pearl V. Ryder, Rebecca Senft, Beth A. Cimini, Ryan R. Murray, Chantal Nyirakanani, Tong Hao, Gregory G. McClain, Frederick P. Roth, Michael A. Calderwood, David E. Hill, Marc Vidal, S. Stephen Yi, Nidhi Sahni, Jian Peng, Anne-Claude Gingras, Shantanu Singh, Anne E. Carpenter, Mikko Taipale

Read the paper

Caption

Mislocalization map of missense variants. The overall pattern of mislocalization is shown in the center. Each line represents a mislocalized variant. The color of the line indicates destination compartment (i.e., mislocalization compartment). Examples of mislocalized variants for different categories are shown with manual annotation and the associated disease phenotype. Scale bar, 20 μm. Some cellular structures were created with Biorender.com. See also Figures S2 and S3.

Citation

Jessica Lacoste, Marzieh Haghighi, Shahan Haider, Chloe Reno, Zhen-Yuan Lin, Dmitri Segal, Wesley Wei Qian, Xueting Xiong, Tanisha Teelucksingh, Esteban Miglietta, Hamdah Shafqat-Abbasi, Pearl V. Ryder, Rebecca Senft, Beth A. Cimini, Ryan R. Murray, Chantal Nyirakanani, Tong Hao, Gregory G. McClain, Frederick P. Roth, Michael A. Calderwood, David E. Hill, Marc Vidal, S. Stephen Yi, Nidhi Sahni, Jian Peng, Anne-Claude Gingras, Shantanu Singh, Anne E. Carpenter, Mikko Taipale. Pervasive mislocalization of pathogenic coding variants underlying human disorders. Cell 187, 6725-6741.e13 (2024). https://doi.org/10.1016/j.cell.2024.09.003

Back to the plate

Figure 1 from Capturing cell heterogeneity in representations of cell populations for image-based profiling using contrastive learning
Figure 1.

2024, PLOS Computational Biology. Well F6.

Capturing cell heterogeneity in representations of cell populations for image-based profiling using contrastive learning

Robert van Dijk, John Arevalo, Mehrtash Babadi, Anne E. Carpenter, Shantanu Singh

Read the paper

Caption

(a) Human U2OS cells treated with dimethyl sulfoxide (DMSO) and stained using the Cell Painting assay, which employs six dyes in five channels to label eight cellular compartments. The top row (from left to right) shows mitochondrial staining; actin, Golgi, and plasma membrane staining; and nucleolar and cytoplasmic RNA staining. The bottom row (from left to right) displays endoplasmic reticulum staining, DNA staining, and a montage of all five channels (from Cimini et al. [21]). (b) Thousands of features are extracted from each segmented cell in microscopy images of wells. A learned function f(x) (CytoSummaryNet) aggregates this data into a single feature vector: the sample’s profile. (c) An in-depth look at the model architecture used in this study. The model consists of three elements: a function φ(x), which maps the input data from ℝD to ℝL space, a summation, which collapses the cell dimension, and ρ(z), which maps the collapsed representation from ℝN to ℝL space. (d) During training, replicate compound profiles are forced to attract each other (green arrows) and simultaneously repel every other compound (red arrows) in the learned feature space. Here, all forces are drawn for a single profile of compound B.

Citation

Robert van Dijk, John Arevalo, Mehrtash Babadi, Anne E. Carpenter, Shantanu Singh. Capturing cell heterogeneity in representations of cell populations for image-based profiling using contrastive learning. PLOS Computational Biology 20, 1012547 (2024). https://doi.org/10.1371/journal.pcbi.1012547

Back to the plate

2025

Figure 2 from Foreground-aware Virtual Staining for Accurate 3D Cell Morphological Profiling
Figure 2.

2025, arXiv. Well F7.

Foreground-aware Virtual Staining for Accurate 3D Cell Morphological Profiling

Alexandr A. Kalinin, Paula Llanos, Theresa Maria Sommer, Giovanni Sestini, Xinhai Hou, Jonathan Z. Sexton, Xiang Wan, Ivo D. Dinov, Brian D. Athey, Nicolas Rivron, Anne E. Carpenter, Beth Cimini, Shantanu Singh, Matthew J. O'Meara

Read the paper

Caption

Performance evaluation on the Allen Cell Label-free Imaging dataset. a: Visualizations of F-net and Spotlight predictions demonstrate differences in BG prediction. b: Image quality metrics indicate that Spotlight preserves the same level of detail in FG intensities. c,e: Visualizations of watershed and Cellpose segmentation results show artifacts when segmenting F-net predictions. d,f: Segmentation and feature-level metrics indicate that less noisy predictions by Spotlight produce more accurate morphologies.

Citation

Alexandr A. Kalinin, Paula Llanos, Theresa Maria Sommer, Giovanni Sestini, Xinhai Hou, Jonathan Z. Sexton, Xiang Wan, Ivo D. Dinov, Brian D. Athey, Nicolas Rivron, Anne E. Carpenter, Beth Cimini, Shantanu Singh, Matthew J. O'Meara. Foreground-aware Virtual Staining for Accurate 3D Cell Morphological Profiling. arXiv (2025). https://doi.org/10.48550/arXiv.2507.05383

Back to the plate

Figure 1 from Learning Molecular Representation in a Cell
Figure 1.

2025, International Conference on Learning Representations (ICLR 2025). Well F8.

Learning Molecular Representation in a Cell

Gang Liu, Srijit Seal, John Arevalo, Zhenwen Liang, Anne E. Carpenter, Meng Jiang, Shantanu Singh

Read the paper

Caption

Comparison of Representation Learning Methods: (a) Existing contrastive methods use two encoders—one for molecules and another for cell morphology or gene expression features—without sharing the molecule encoders for different alignment targets. (b) InfoAlign remove redundant information from molecules, cell morphology, and gene expressions based on the information bottleneck, resulting in more concise yet predictive molecular representations [1].

Citation

Gang Liu, Srijit Seal, John Arevalo, Zhenwen Liang, Anne E. Carpenter, Meng Jiang, Shantanu Singh. Learning Molecular Representation in a Cell. International Conference on Learning Representations (ICLR 2025), 8540-8562 (2025). https://proceedings.iclr.cc/paper_files/paper/2025/hash/18610cbcd1da57854aa05ebdc5cd3168-Abstract-Conference.html

Back to the plate

Figure 2 from Image-Based Profiling in Live Cells Using Live Cell Painting
Figure 2.

2025, Bio-protocol. Well F9.

Image-Based Profiling in Live Cells Using Live Cell Painting

Thaís Moraes-Lacerda, Mariana Rodrigues-da-Silva, Shantanu Singh, Marcelo Bispo de Jesus

Read the paper

Caption

Fluorescence image of MCF-7 cells stained with 10 μM acridine orange (AO), acquired using a 20× objective. The green channel (GFP) highlights nuclei, nucleoli, and cytoplasm, while the red channel (PI) selectively labels acidic vesicular compartments (e.g., lysosomes, endosomes, and autophagolysosomes, among others). Brightness and contrast were adjusted to enhance visualization. The merged image displays the combined spatial distribution of both signals. Scale bar = 100 μm.

Citation

Thaís Moraes-Lacerda, Mariana Rodrigues-da-Silva, Shantanu Singh, Marcelo Bispo de Jesus. Image-Based Profiling in Live Cells Using Live Cell Painting. Bio-protocol 15, e5464 (2025). https://doi.org/10.21769/BioProtoc.5464

Back to the plate

Figure 1 from cp_measure: API-first feature extraction for image-based profiling workflows
Figure 1.

2025, arXiv. Well F10.

cp_measure: API-first feature extraction for image-based profiling workflows

Alán F. Muñoz, Tim Treis, Alexandr A. Kalinin, Shatavisha Dasgupta, Fabian Theis, Anne E. Carpenter, Shantanu Singh

Read the paper

Caption

cp_measure generates features from images by using information in every region of interest ("object"). It can featurize the pairwise combination of all the available channels (colours) and objects. The resultant matrices represent the entire experiment and can be studied using statistical, machine, and deep learning methods.

Citation

Alán F. Muñoz, Tim Treis, Alexandr A. Kalinin, Shatavisha Dasgupta, Fabian Theis, Anne E. Carpenter, Shantanu Singh. cp_measure: API-first feature extraction for image-based profiling workflows. arXiv (2025). https://doi.org/10.48550/arXiv.2507.01163

Back to the plate

Figure 2 from A genome-wide atlas of human cell morphology
Figure 2.

2025, Nature Methods. Well F11.

A genome-wide atlas of human cell morphology

Meraj Ramezani, Erin Weisbart, Julia Bauman, Avtar Singh, John Yong, Maria Lozada, Gregory P. Way, Sanam L. Kavari, Celeste Diaz, Eddy Leardini, Gunjan Jetley, Jenlu Pagnotta, Marzieh Haghighi, Thiago M. Batista, Joaquín Pérez-Schindler, Melina Claussnitzer, Shantanu Singh, Beth A. Cimini, Paul C. Blainey, Anne E. Carpenter, Calvin H. Jan, James T. Neal

Read the paper

Caption

Summary of the results from two PERISCOPE screens at the whole-genome scale performed in HeLa cells in two growth media (DMEM and HPLM). a, A bar graph representing the number of hit genes identified. Green represents hit genes based on individual compartments (ER, mitochondria (mito), actin, DNA and Golgi/membrane) and blue represents hit genes based on the overall profile. b, The distribution of hit genes based on individual compartments (from a). It is possible for a gene to be hit in multiple compartments without being a whole-cell hit, see Extended Data Fig. 4c–f for details. c, Pie charts showing the average normalized fraction of the number of features significantly different from controls in each phenotypic channel for the genes in the indicated set. Filled wedges represent the channel in which the protein products are known to be present. d, The distributions of optical profile correlations between random hit gene pairs (blue) versus correlations between gene pairs in CORUM4.0 protein complexes (red). e, A boxen plot (letter-value plot) representing STRING scores divided into bins based on PERISCOPE profile correlation between gene pairs, n = 1,930 genes for DMEM and n = 1,553 genes for HPLM. The boxen plots display the data as a distribution where the center line represents the median, the central box represents the interquartile range from 25th to 75th percentile and the subsequent boxes represent increasingly narrower quantiles calculated for half of the remaining data. f,g, UMAP embedding of the hit gene profiles from the HeLa DMEM (f) or HPLM (g) dataset. Each dot represents a genetic perturbation and distance implies the correlation of profiles in a two-dimensional embedding. Manual annotation of cluster functions are presented for highlighted clusters based on GO datasets. Example insets show coherent clustering of related genes. h, The distribution of morphological signal scores for essential and nonessential genes (DepMap gene effect at −0.5 threshold) for all perturbations in the HeLa DMEM and HPLM datasets.

Citation

Meraj Ramezani, Erin Weisbart, Julia Bauman, Avtar Singh, John Yong, Maria Lozada, Gregory P. Way, Sanam L. Kavari, Celeste Diaz, Eddy Leardini, Gunjan Jetley, Jenlu Pagnotta, Marzieh Haghighi, Thiago M. Batista, Joaquín Pérez-Schindler, Melina Claussnitzer, Shantanu Singh, Beth A. Cimini, Paul C. Blainey, Anne E. Carpenter, Calvin H. Jan, James T. Neal. A genome-wide atlas of human cell morphology. Nature Methods 22, 621-633 (2025). https://doi.org/10.1038/s41592-024-02537-7

Back to the plate

Figure 1 from Reproducible image-based profiling with Pycytominer
Figure 1.

2025, Nature Methods. Well F12.

Reproducible image-based profiling with Pycytominer

Erik Serrano, Srinivas Niranj Chandrasekaran, Dave Bunten, Kenneth I. Brewer, Jenna Tomkinson, Roshan Kern, Michael Bornholdt, Stephen J. Fleming, Ruifan Pei, John Arevalo, Hillary Tsang, Vincent Rubinetti, Callum Tromans-Coia, Tim Becker, Erin Weisbart, Charlotte Bunne, Alexandr A. Kalinin, Rebecca Senft, Stephen J. Taylor, Nasim Jamali, Adeniyi Adeboye, Hamdah Shafqat Abbasi, Allen Goodman, Juan C. Caicedo, Anne E. Carpenter, Beth A. Cimini, Shantanu Singh, Gregory P. Way

Read the paper

Caption

The standard image-based profiling experiment and the role of Pycytominer. a, In the experimental phase, a scientist plates cells, often perturbing them with chemical or genetic agents, and performs microscopy imaging. In image analysis, using CellProfiler for example, a scientist applies several data-processing steps to generate image-based profiles. In addition, scientists can apply deep-learning tools, such as DeepProfiler, to generate image-based profiles. b, Pycytominer performs image-based profiling to process morphology features and make them ready for downstream analyses. c, Pycytominer performs five fundamental functions, each implemented with a simple and intuitive API. Each function enables a user to implement various methods for executing operations. Created in BioRender.com.

Citation

Erik Serrano, Srinivas Niranj Chandrasekaran, Dave Bunten, Kenneth I. Brewer, Jenna Tomkinson, Roshan Kern, Michael Bornholdt, Stephen J. Fleming, Ruifan Pei, John Arevalo, Hillary Tsang, Vincent Rubinetti, Callum Tromans-Coia, Tim Becker, Erin Weisbart, Charlotte Bunne, Alexandr A. Kalinin, Rebecca Senft, Stephen J. Taylor, Nasim Jamali, Adeniyi Adeboye, Hamdah Shafqat Abbasi, Allen Goodman, Juan C. Caicedo, Anne E. Carpenter, Beth A. Cimini, Shantanu Singh, Gregory P. Way. Reproducible image-based profiling with Pycytominer. Nature Methods 22, 677-680 (2025). https://doi.org/10.1038/s41592-025-02611-8

Back to the plate

Figure 2 from Cell morphological representations of genes enhance prediction of drug targets
Figure 2.

2025, bioRxiv. Well G1.

Cell morphological representations of genes enhance prediction of drug targets

Niveditha S. Iyer, Daniel J. Michael, S-Y Gordon Chi, John Arevalo, Srinivas Niranj Chandrasekaran, Anne E. Carpenter, Pranav Rajpurkar, Shantanu Singh

Read the paper

Caption

Leave-out-compound performance; retrieving the correct gene target for a “novel” compound (one that has not been seen during training). (a) Proposed method ("model (w. embed.)") vs. baselines: gene-compound similarity ("gene-cpd simil."), 1-NN compound classifier trained for each gene ("1-nn cpd"), transformer without embeddings ("model (w/o embed.)"). Error bars: 95% CI. (b) Counts of two categories of positive gene-compound pairings from the test set: positive gene-compound pairings where the test gene is connected to a training compound ("compound") or not ("neither"). Test compounds are never in the training set. (c) Model predictions of positive gene-compound pairings from test set (as percentiles): correct classification is likelier (top percentile) if the test gene is connected to a training compound (red) vs. not (blue). (d) Model predictions of positive gene-compound pairings from test set (as log-scaled percentiles) by number of training compounds connected to the test gene: performance improves with more connections.

Citation

Niveditha S. Iyer, Daniel J. Michael, S.-Y. Gordon Chi, John Arevalo, Srinivas Niranj Chandrasekaran, Anne E. Carpenter, Pranav Rajpurkar, Shantanu Singh. Cell morphological representations of genes enhance prediction of drug targets. bioRxiv (2025). https://doi.org/10.1101/2024.06.08.598076

Back to the plate

Figure 1 from Machine Learning for Toxicity Prediction Using Chemical Structures: Pillars for Success in the Real World
Figure 1.

2025, Chemical Research in Toxicology. Well G2.

Machine Learning for Toxicity Prediction Using Chemical Structures: Pillars for Success in the Real World

Srijit Seal, Manas Mahale, Miguel García-Ortegón, Chaitanya K. Joshi, Layla Hosseini-Gerami, Alex Beatson, Matthew Greenig, Mrinal Shekhar, Arijit Patra, Caroline Weis, Arash Mehrjou, Adrien Badré, Brianna Paisley, Rhiannon Lowe, Shantanu Singh, Falgun Shah, Bjarki Johannesson, Dominic Williams, David Rouquie, Djork-Arné Clevert, Patrick Schwab, Nicola Richmond, Christos A. Nicolaou, Raymond J. Gonzalez, Russell Naven, Carolin Schramm, Lewis R Vidler, Kamel Mansouri, W. Patrick Walters, Deidre Dalmas Wilk, Ola Spjuth, Anne E. Carpenter, Andreas Bender

Read the paper

Caption

Five critical pillars deserving attention from researchers using ML tools for toxicity prediction are discussed in this review. Pillar 1: Choice of data end points, data sets, and data preparation.

Citation

Srijit Seal, Manas Mahale, Miguel García-Ortegón, Chaitanya K. Joshi, Layla Hosseini-Gerami, Alex Beatson, Matthew Greenig, Mrinal Shekhar, Arijit Patra, Caroline Weis, Arash Mehrjou, Adrien Badré, Brianna Paisley, Rhiannon Lowe, Shantanu Singh, Falgun Shah, Bjarki Johannesson, Dominic Williams, David Rouquie, Djork-Arné Clevert, Patrick Schwab, Nicola Richmond, Christos A. Nicolaou, Raymond J. Gonzalez, Russell Naven, Carolin Schramm, Lewis R. Vidler, Kamel Mansouri, W. Patrick Walters, Deidre Dalmas Wilk, Ola Spjuth, Anne E. Carpenter, Andreas Bender. Machine Learning for Toxicity Prediction Using Chemical Structures: Pillars for Success in the Real World. Chemical Research in Toxicology 38, 759-807 (2025). https://doi.org/10.1021/acs.chemrestox.5c00033

Back to the plate

Figure 1 from A versatile information retrieval framework for evaluating profile strength and similarity
Figure 1.

2025, Nature Communications. Well G3.

A versatile information retrieval framework for evaluating profile strength and similarity

Alexandr A. Kalinin, John Arevalo, Erik Serrano, Loan Vulliard, Hillary Tsang, Michael Bornholdt, Alán F. Muñoz, Suganya Sivagurunathan, Bartek Rajwa, Anne E. Carpenter, Gregory P. Way, Shantanu Singh

Read the paper

Caption

Schematic overview of the mAP framework. A A typical output of a profiling experiment contains multiple replicate profiles for each perturbation and controls. B To measure average precision (AP) per perturbation replicate, we selected one replicate profile as a query and measured distances to its other replicates and controls. C Profiles were then ranked by decreasing similarity (increasing distance) to the query; the rank list was converted to binary form and used to calculate precision Pk and recall Rk at each rank k. D Average precision was calculated by averaging precision values over those ranks k containing perturbation replicates, which corresponds to a non-interpolated approximation of the area under the precision-recall curve. E By applying this procedure to each perturbation replicate, we calculated a set of AP scores that were then averaged to obtain a mAP score for a perturbation’s phenotypic activity. F One can also apply the same framework to retrieving groups of perturbations with the same biological annotations (rather than groups of replicates of the same perturbation)—for example, compounds that share the same mechanism of action (MoA)—by calculating the mAP score per each group of perturbations (MoA). Source data are provided as a Source Data file.

Citation

Alexandr A. Kalinin, John Arevalo, Erik Serrano, Loan Vulliard, Hillary Tsang, Michael Bornholdt, Alán F. Muñoz, Suganya Sivagurunathan, Bartek Rajwa, Anne E. Carpenter, Gregory P. Way, Shantanu Singh. A versatile information retrieval framework for evaluating profile strength and similarity. Nature Communications 16, 5181 (2025). https://doi.org/10.1038/s41467-025-60306-2

Back to the plate

Figure 3 from Live-cell painting: Image-based profiling in live cells using acridine orange
Figure 3.

2025, Molecular Biology of the Cell. Well G4.

Live-cell painting: Image-based profiling in live cells using acridine orange

Fernanda Garcia-Fossa, Thaís Moraes-Lacerda, Mariana Rodrigues-da-Silva, Barbara Diaz-Rohrer, Shantanu Singh, Anne E. Carpenter, Beth A. Cimini, Marcelo Bispo de Jesus

Read the paper

Caption

AO captures the dose-response effect induced by silver nanoparticles (AgNPs) on Huh-7 cells. Huh-7 cells were treated with Ag100 (nanoparticle size 100 nm) at increasing concentrations for 24 h. Then the images were acquired after AO staining (Cytation 5, 20× objective). Objects were segmented using Cellpose software, and features were extracted using CellProfiler software. Next, features were aggregated by well, normalized, and selected using Pycytominer and batch corrected using pyComBat. (A) t-SNE was used for dimensionality reduction and visualization. After 100 iterations, the mean and SD embedding were calculated. Because the profiles were normalized relative to the negative control, these were not included in the plot. (B) Random forest ran for 100 iterations to differentiate between two classes: negative control versus combining Ag100 0.556 and 1.111 µM. Then, the mean feature importance and SD were calculated. Morpheus software was used to perform marker selection between the same random forest classified groups, and the top 30 features were selected and compared. Among those, eight features were consistent between methods and were plotted to show the fold change compared with the negative control. The two features highlighted by black boxes are presented in C and D; (C) Texture entropy in the cytoplasm measured in the AO-red channel. Entropy represents the complexity of the image, with higher values, indicating greater heterogeneity in fluorescence intensity patterns; (D) The spatial moment of the nuclei, representing the shape, size, rotation, and location of the nuclear object; and (E) Representative images were retrieved from the dataset using k means clustering (Garcia-Fossa et al., 2023). Experiments were performed in three independent replicates, n = 3 and each point in the plots consists of well-aggregated data, and the points are colored by the batch in C and D. An independent t test calculated using the statannotations library. *p statistical difference < 0.05. Scale bar, 25 µm.

Citation

Fernanda Garcia-Fossa, Thaís Moraes-Lacerda, Mariana Rodrigues-da-Silva, Barbara Diaz-Rohrer, Shantanu Singh, Anne E. Carpenter, Beth A. Cimini, Marcelo Bispo de Jesus. Live-cell painting: Image-based profiling in live cells using acridine orange. Molecular Biology of the Cell 36, mr7 (2025). https://doi.org/10.1091/mbc.E24-07-0308

Back to the plate

Figure 3 from Combining phenomics with transcriptomics reveals cell-type-specific morphological and molecular signatures of the 22q11.2 deletion
Figure 3.

2025, Nature Communications. Well G5.

Combining phenomics with transcriptomics reveals cell-type-specific morphological and molecular signatures of the 22q11.2 deletion

Matthew Tegtmeyer, Dhara Liyanage, Yu Han, Kathryn B. Hebert, Ruifan Pei, Gregory P. Way, Pearl V. Ryder, Derek Hawes, Callum Tromans-Coia, Beth A. Cimini, Anne E. Carpenter, Shantanu Singh, Ralda Nehme

Read the paper

Caption

Genotype-specific morphological signatures in 22q11.2 deletion syndrome. a Correlation matrix of NeuroPainting profiles for iPSCs, progenitors, neurons, and astrocytes from control and 22q11.2 deletion cell lines. The green and purple notation on the left of the plot indicates control versus deletion genotype. The rainbow notation corresponds to individual cell line aliases. b Barplot for significantly different features as measured by the Wilcoxon rank sum-test between control and 22q11.2 deletion carriers across each cell type. Features were significant if they passed an FDR threshold of 5%. c Venn diagram showing the number of significant features that overlap across the different cell types. d Dotplot of feature characteristics for 72 overlapping significant features. e Dotplot of feature values for Cytoplasm_Correlation_RWC_ER_Mito across each cell type (n = 22 per genotype, per cell type). Error bars represent the standard error of the mean. f Representative images for min/max values for Cytoplasm_Correlation_RWC_ER_Mito in control (top) and 22q11.2 (bottom) astrocytes. Minimum and maximum values are based on per-well INT transformed feature values. Images were selected based on the highest and lowest average feature value for both control and 22q11.2 deletion carriers. Scale bar is 50 μm.

Citation

Matthew Tegtmeyer, Dhara Liyanage, Yu Han, Kathryn B. Hebert, Ruifan Pei, Gregory P. Way, Pearl V. Ryder, Derek Hawes, Callum Tromans-Coia, Beth A. Cimini, Anne E. Carpenter, Shantanu Singh, Ralda Nehme. Combining phenomics with transcriptomics reveals cell-type-specific morphological and molecular signatures of the 22q11.2 deletion. Nature Communications 16, 6332 (2025). https://doi.org/10.1038/s41467-025-61547-x

Back to the plate

Figure 1 from Morphological map of under- and overexpression of genes in human cells
Figure 1.

2025, Nature Methods. Well G6.

Morphological map of under- and overexpression of genes in human cells

Srinivas Niranj Chandrasekaran, Eric Alix, John Arevalo, Adriana Borowa, Patrick J. Byrne, William G. Charles, Zitong S. Chen, Beth A. Cimini, Boxiong Deng, John G. Doench, Jessica D. Ewald, Briana Fritchman, Colin J. Fuller, Jedidiah Gaetz, Amy Goodale, Marzieh Haghighi, Yu Han, Zahra Hanifehlou, Holger Hennig, Desiree Hernandez, Christina B. Jacob, Tim James, Tomasz Jetka, Alexandr A. Kalinin, Ben Komalo, Maria Kost-Alimova, Tomasz Krawiec, Brittany A. Marion, Glynn Martin, Nicola Jane McCarthy, Lisa Miller, Arne Monsees, Nikita Moshkov, Alán F. Muñoz, Arnaud Ogier, Magdalena Otrocka, Krzysztof Rataj, David E. Root, Francesco Rubbo, Simon Scrace, Douglas W. Selinger, Rebecca A. Senft, Peter Sommer, Amandine Thibaudeau, Sarah Trisorus, Rahul Valiya Veettil, William J. Van Trump, Sui Wang, Michał Warchoł, Erin Weisbart, Amélie Weiss, Michael Wiest, Agata Zaremba, Andrei Zinovyev, Shantanu Singh, Anne E. Carpenter

Read the paper

Caption

JUMP Cell Painting dataset overview. a, Example images of overexpressed genes (ORFs) and knocked-out genes (CRISPR) that are most dissimilar from negative controls (negcon) are shown. Negative control images are selected randomly from the ORF and CRISPR dataset. Channels are DNA, nucleus (Hoechst); AGP, actin cytoskeleton (phalloidin) plus the Golgi and plasma membrane (wheat germ agglutinin); Mito, mitochondria (MitoTracker); ER, endoplasmic reticulum (concanavalin A) and RNA, nucleoli and cytoplasmic RNA (SYTO 14). b,c, Experimental design schematics for dataset generation. The number of plates, plate maps and batch in the ORF (b) and CRISPR (c) datasets are shown. Polybrene was added to most ORF plates, which are also shown. Detailed information regarding perturbation types per plate and other experimental conditions (for example, cell seeding density) can be found in Methods.

Citation

Srinivas Niranj Chandrasekaran, Eric Alix, John Arevalo, Adriana Borowa, Patrick J. Byrne, William G. Charles, Zitong S. Chen, Beth A. Cimini, Boxiong Deng, John G. Doench, Jessica D. Ewald, Briana Fritchman, Colin J. Fuller, Jedidiah Gaetz, Amy Goodale, Marzieh Haghighi, Yu Han, Zahra Hanifehlou, Holger Hennig, Desiree Hernandez, Christina B. Jacob, Tim James, Tomasz Jetka, Alexandr A. Kalinin, Ben Komalo, Maria Kost-Alimova, Tomasz Krawiec, Brittany A. Marion, Glynn Martin, Nicola Jane McCarthy, Lisa Miller, Arne Monsees, Nikita Moshkov, Alán F. Muñoz, Arnaud Ogier, Magdalena Otrocka, Krzysztof Rataj, David E. Root, Francesco Rubbo, Simon Scrace, Douglas W. Selinger, Rebecca A. Senft, Peter Sommer, Amandine Thibaudeau, Sarah Trisorus, Rahul Valiya Veettil, William J. Van Trump, Sui Wang, Michał Warchoł, Erin Weisbart, Amélie Weiss, Michael Wiest, Agata Zaremba, Andrei Zinovyev, Shantanu Singh, Anne E. Carpenter. Morphological map of under- and overexpression of genes in human cells. Nature Methods 22, 1742-1752 (2025). https://doi.org/10.1038/s41592-025-02753-9

Back to the plate

Figure 1 from The OASIS Consortium: integrating multi-omics technologies to transform chemical safety assessment
Figure 1.

2025, Toxicological Sciences. Well G7.

The OASIS Consortium: integrating multi-omics technologies to transform chemical safety assessment

David Rouquié, Andreas Bender, Jaime Cheah, Christine E Crute, Deidre Dalmas, Jessica Ewald, Aaron Fullerton, Joshua A Harrill, Sabah Kadri, Nicole Kleinstreuer, Nynke Kramer, Jessica LaRocca, Constance A Mitchell, Srijit Seal, Shantanu Singh, Anne E Carpenter

Read the paper

Caption

OASIS Consortium strategy. Chemical structures will be linked to different ‘omics measurements as predictive variables, as well as drug-induced liver injury (DILI) organ toxicity endpoints. The aim of the OASIS project is then to identify which in vitro proxy endpoints are predictive for in vivo toxicity, in which species, and at which dose. The aim is to establish confidence in ‘omics profiles as New Approach Methodologies and to determine best practices related to liver toxicity, with implications also for the wider field. RPH, rat primary hepatocyte; HPH, human primary hepatocyte; iPSC, induced pluripotent stem cell; qIVIVE, quantitative in vitro to in vivo extrapolation; POD, point of departure. The picture representing the internal exposure is derived from Pearce et al. (2017).

Citation

David Rouquié, Andreas Bender, Jaime Cheah, Christine E. Crute, Deidre Dalmas, Jessica Ewald, Aaron Fullerton, Joshua A. Harrill, Sabah Kadri, Nicole Kleinstreuer, Nynke Kramer, Jessica LaRocca, Constance A. Mitchell, Srijit Seal, Shantanu Singh, Anne E. Carpenter. The OASIS Consortium: integrating multi-omics technologies to transform chemical safety assessment. Toxicological Sciences 208, 225-232 (2025). https://doi.org/10.1093/toxsci/kfaf128

Back to the plate

Figure 3 from Alternate dyes for image-based profiling assays
Figure 3.

2025, SLAS Discovery. Well G8.

Alternate dyes for image-based profiling assays

Suganya Sivagurunathan, Patrick Byrne, Alán F. Muñoz, John Arevalo, Anne E. Carpenter, Shantanu Singh, Maria Kost-Alimova, Beth A. Cimini

Read the paper

Caption

Visualization of cells with ChromaLive dye. Representative images of U2OS cells that were treated with compounds at 5 mM (top to bottom) and stained with ChromaLive dye, which gets excited at 488 nm and 561 nm and emits at three different wavelengths. Images from different emission wavelengths - 488Red, 488Yellow, and 561Yellow - are shown here. Scale bar- 20 µm. CP - Cell Painting.

Citation

Suganya Sivagurunathan, Patrick Byrne, Alán F. Muñoz, John Arevalo, Anne E. Carpenter, Shantanu Singh, Maria Kost-Alimova, Beth A. Cimini. Alternate dyes for image-based profiling assays. SLAS Discovery 36, 100268 (2025). https://doi.org/10.1016/j.slasd.2025.100268

Back to the plate

Figure 2 from Cubic: CUDA-Accelerated 3D Bioimage Computing
Figure 2.

2025, IEEE/CVF International Conference on Computer Vision Workshops (ICCVW 2025). Well G9.

Cubic: CUDA-Accelerated 3D Bioimage Computing

Alexandr A. Kalinin, Anne E. Carpenter, Shantanu Singh, Matthew J. O'Meara

Read the paper

Caption

CellProfiler 3D monolayer segmentation benchmark results. (a) Visual validation showing similar segmentation quality between CellProfiler and cubic implementations. (b) Performance comparison demonstrating significant computational speedup using GPU.

Citation

Alexandr A. Kalinin, Anne E. Carpenter, Shantanu Singh, Matthew J. O'Meara. Cubic: CUDA-Accelerated 3D Bioimage Computing. IEEE/CVF International Conference on Computer Vision Workshops (ICCVW 2025), 5831-5840 (2025). https://doi.org/10.1109/iccvw69036.2025.00608

Back to the plate

Figure 1 from nELISA: a high-throughput, high-plex platform enables quantitative profiling of the inflammatory secretome
Figure 1.

2025, Nature Methods. Well G10.

nELISA: a high-throughput, high-plex platform enables quantitative profiling of the inflammatory secretome

Milad Dagher, Grant Ongo, Nathaniel Robichaud, Jinglin Kong, Woojong Rho, Ivan Teahulos, Arya Tavakoli, Samantha Bovaird, Shahem Merjaneh, Andrew Tan, Kiran Edwardson, Christelle Scheepers, Andy Ng, Andy Hajjar, Baly Sow, Michael Vrouvides, Andy Lee, Philippe DeCorwin-Martin, Shafqat Rasool, Jiamin Huang, Timothy Erps, Spencer Coffin, Narges M. Rashidi, Yu Han, Srinivas Niranj Chandrasekaran, Lisa Miller, Maria Kost-Alimova, Adam Skepner, Shantanu Singh, Anne E. Carpenter, Jeffrey D. Munzar, David Juncker

Read the paper

Caption

CLAMP. a, Each barcoded microparticle has preassembled, miniaturized ELISAs for a single target. (1) CLAMP: the detection antibody (dAb) is bound to a hook oligo (HO) that is tethered to the surface via partial hybridization with a capture oligo (CO) strand. (2) Antigen capture: the assay is carried out by incubating the biological sample with barcoded CLAMPs generating sandwich binding in the presence of the target analyte only. (3) Displacement oligo: after washing, a fluorescently labeled displacement oligo (DO) is added to displace HOs from their prehybridized COs via toehold-mediated displacement. The toehold region on DO (b) binds the complementary single-stranded region (b*) on HO, initiating strand displacement. This interaction unzips CO (a) from its complementary HO sequence (a*), as DO (a) replaces it, releasing HO from CO and fluorescently labeling it. (4) Target readout: labeling of the sandwich complexes that remain on the surface due to target presence and sandwich formation (left) or washing away of the dAb-DO hybrid in the case of off-target binding/absence of target (right). cAb, capture antibody. b–e, Examples of nELISA configurations enabling multiplexed measurements. b, Secreted proteins. Increased levels of inflammatory markers IL-2 and IL-10 upon stimulation of PBMCs with ConA at 0 ng ml−1 and 12,500 ng ml−1; n = 108 samples from 6 donors for each stimulation condition; Bar height represents the mean; error bars indicate the s.e.m. c, Intracellular proteins. Configuration is identical to that of secreted proteins, but with antibodies targeting intracellular proteins; swarm plot with nELISA measurements (n = 2) of total levels of indicated proteins in HEK293 cells or HEK293 cells overexpressing one of the target proteins. d, Posttranslational modification. The dAb is specific to a PTM (for example, phosphorylation); shown are violin plots with measurements (n = 2, indicated with line) for total RELA and phosphorylated RELA in cell lines with indicated treatments resulting in distinct levels of RELA expression and phosphorylation. e, Protein–protein interactions. Each antibody of an ELISA pair binds to a distinct member of a PPI; shown are four parameter logistic curve fits of total IL-15 and the IL-15–IL-15RA dimer with their respective sensors, in the presence of recombinant IL-15 (left) or IL-15–IL-15RA (right).

Citation

Milad Dagher, Grant Ongo, Nathaniel Robichaud, Jinglin Kong, Woojong Rho, Ivan Teahulos, Arya Tavakoli, Samantha Bovaird, Shahem Merjaneh, Andrew Tan, Kiran Edwardson, Christelle Scheepers, Andy Ng, Andy Hajjar, Baly Sow, Michael Vrouvides, Andy Lee, Philippe DeCorwin-Martin, Shafqat Rasool, Jiamin Huang, Timothy Erps, Spencer Coffin, Narges M. Rashidi, Yu Han, Srinivas Niranj Chandrasekaran, Lisa Miller, Maria Kost-Alimova, Adam Skepner, Shantanu Singh, Anne E. Carpenter, Jeffrey D. Munzar, David Juncker. nELISA: a high-throughput, high-plex platform enables quantitative profiling of the inflammatory secretome. Nature Methods 22, 2375-2385 (2025). https://doi.org/10.1038/s41592-025-02861-6

Back to the plate

Figure 1 from Acquisition, quality control, and architecture of a large image dataset as a tool for in silico cell biological research
Figure 1.

2025, Materials Today Bio. Well G11.

Acquisition, quality control, and architecture of a large image dataset as a tool for in silico cell biological research

Nikita Konshin, Marta Garcia Valverde, Danila Solodennikov, Koen Minartz, Vlado Menkovski, Rosalinde Masereeuw, Shantanu Singh, Silvia M. Mihăilă, Jan de Boer

Read the paper

Caption

Design, manufacturing and screening of the TopoChip platform.

Citation

Nikita Konshin, Marta Garcia Valverde, Danila Solodennikov, Koen Minartz, Vlado Menkovski, Rosalinde Masereeuw, Shantanu Singh, Silvia M. Mihăilă, Jan de Boer. Acquisition, quality control, and architecture of a large image dataset as a tool for in silico cell biological research. Materials Today Bio 35, 102352 (2025). https://doi.org/10.1016/j.mtbio.2025.102352

Back to the plate

Figure 1 from Cell Painting: a decade of discovery and innovation in cellular imaging
Figure 1.

2025, Nature Methods. Well G12.

Cell Painting: a decade of discovery and innovation in cellular imaging

Srijit Seal, Maria-Anna Trapotsi, Ola Spjuth, Shantanu Singh, Jordi Carreras-Puigvert, Nigel Greene, Andreas Bender, Anne E. Carpenter

Read the paper

Caption

Morphological profiling using Cell Painting. a, Schematic of the Cell Painting assay; cells are incubated and perturbed and a set of six stains is applied. b, Images are then obtained in five channels by automated microscopy followed by nucleus and cell body segmentation. c, Appropriate software or deep-learning-based methods are applied to measure or calculate morphological features from the images. d, After feature preprocessing, downstream analysis is performed. This includes a variety of methods, including supervised and unsupervised machine learning, to better elucidate the biological effects of a compound, such as its mechanism of action or safety profile. e,f, Adaptations of the Cell Painting assay include BODIPY to mark lipid droplets in lipid-accumulating cells (e) and a coronavirus antibody against human coronavirus 229E (CoV-229E) viral protein (f).

Citation

Srijit Seal, Maria-Anna Trapotsi, Ola Spjuth, Shantanu Singh, Jordi Carreras-Puigvert, Nigel Greene, Andreas Bender, Anne E. Carpenter. Cell Painting: a decade of discovery and innovation in cellular imaging. Nature Methods 22, 254-268 (2025). https://doi.org/10.1038/s41592-024-02528-8

Back to the plate

2026

Figure 1 from JUMP-lite: Compact, reproducible benchmarking of cell representations
Figure 1.

2026, arXiv. Well H1.

JUMP-lite: Compact, reproducible benchmarking of cell representations

Alán F. Muñoz, Johan Fredin Haslum, Runxi Shen, Anne E. Carpenter, Shantanu Singh

Read the paper

Caption

JUMP-lite substantially reduces storage while focusing on annotated perturbations for benchmarking. (a) Compound candidates were mapped to the union of MOTIVE’s compound–compound (CC) and compound–gene (CG) graphs, then passed through filters for plate quality, profile quality and replicate count. Supplementary Section S1.1 provides detailed component and annotation accounting, and Supplementary Figure S1 shows target overlap across the compound, CRISPR, and ORF components. (b) Disk-size comparison of JUMP Cell Painting with lossless and lossy compression options. Each square’s area is directly proportional to its disk size. (c) Standardized pipeline from images to evaluation. ALIBY [29] orchestrates segmentation (Cellpose) and feature extraction (cp measure), while Nahual connects isolated environments for deep learning models. A normalization sweep processes the profiles for comparison across methods.

Citation

Alán F. Muñoz, Johan Fredin Haslum, Runxi Shen, Anne E. Carpenter, Shantanu Singh. JUMP-lite: Compact, reproducible benchmarking of cell representations. arXiv (2026). https://doi.org/10.48550/arXiv.2608.07632

Back to the plate

Figure 1 from Science sandboxes measure the scientific capability of AI agents
Figure 1. This image is part of the figure, and the caption describes the whole figure.

2026, arXiv. Well H2.

Science sandboxes measure the scientific capability of AI agents

Arya S. Rao, Rodrigo I. Castro, Sager J. Gosai, Kenneth B. Hsu, Yasha Ektefaie, Shantanu Singh, Sangeeta N. Bhatia, Steven K. Reilly, Ryan Tewhey, Eric S. Lander, Pardis C. Sabeti

Read the paper

With the blog post

Measuring the frontier of scientific capability in the age of AI

Arya Rao, Bryan Hsu, Yasha Ektefaie, Jackson Weir, Sandeep Kambhampati, Frank Liu, Fei Chen, Sangeeta Bhatia, Shantanu Singh, Eric Lander, Pardis Sabeti

Read the blog post

Caption

Science sandboxes for closed-loop evaluation of AI experimentalists. (a) A science sandbox couples an autonomous agent to a sealed oracle through a closed loop of action, feedback, and hypothesis revision. At each design round, the agent proposes a batch of actions, receives feedback from the oracle, records its interpretation, and selects its next actions. The oracle can be wet (a physical experiment), damp (a model trained on experimental data), or dry (an invented rule created by the experimenter). (b) MPRAbox instantiates this framework in regulatory genomics. The agent selects a finite massively parallel reporter assay (MPRA) library from the effectively unbounded space of possible 200 bp regulatory DNA sequences. The library is evaluated by a sealed in silico MPRA oracle that acts as a simulated wet lab, and aggregate performance metrics from diverse hidden evaluation sets are returned to guide subsequent design rounds.

Citation

Arya S. Rao, Rodrigo I. Castro, Sager J. Gosai, Kenneth B. Hsu, Yasha Ektefaie, Shantanu Singh, Sangeeta N. Bhatia, Steven K. Reilly, Ryan Tewhey, Eric S. Lander, Pardis C. Sabeti. Science sandboxes measure the scientific capability of AI agents. arXiv (2026). https://doi.org/10.48550/arXiv.2608.30165

Arya Rao, Bryan Hsu, Yasha Ektefaie, Jackson Weir, Sandeep Kambhampati, Frank Liu, Fei Chen, Sangeeta Bhatia, Shantanu Singh, Eric Lander, Pardis Sabeti. Measuring the frontier of scientific capability in the age of AI. Blog post (2026). https://aryarao.substack.com/p/measuring-the-frontier-of-scientific

Back to the plate

Figure 1 from Same Encoder, Different Winner: A Paired-View Framework for Cell Painting Encoder Evaluation
Figure 1.

2026, arXiv. Well H3.

Same Encoder, Different Winner: A Paired-View Framework for Cell Painting Encoder Evaluation

Tim Treis, Nikita Moshkov, Johan Fredin Haslum, Shantanu Singh, Fabian J. Theis

Read the paper

Caption

Overview of the CP-BG-Bench framework. Left: data engineering pipeline. Source-specific adapters ingest JUMP-CP, RxRx1, and RxRx3-core; images are preprocessed, single-cell crops are extracted, and per-cell quality control yields the final cell pool. Center: four matched views are derived from each cell tile while preserving identity. The raw crop (C); segmented (S) zeroes out everything outside the cell mask; crops with density patches (CD) and segmented with density patches (SD) overlay four corner patches whose intensity encodes local cell count, providing an explicit, source-agnostic density signal. Right: each of the twelve resulting encoder-view configurations per dataset (3 encoders × 4 views) is fine-tuned with LoRA against perturbation embeddings under a multi-positive contrastive objective, producing 36 trained checkpoints in total. The resulting embeddings are evaluated under four community-standard protocols (replicate mAP, scIB batch integration, CellProfiler feature prediction, cross-batch perturbation recall).

Citation

Tim Treis, Nikita Moshkov, Johan Fredin Haslum, Shantanu Singh, Fabian J. Theis. Same Encoder, Different Winner: A Paired-View Framework for Cell Painting Encoder Evaluation. arXiv (2026). https://doi.org/10.48550/arXiv.2609.12761

Back to the plate

Figure 2 from Counting cells can accurately predict small-molecule bioactivity benchmarks
Figure 2. This image is part of the figure, and the caption describes the whole figure.

2026, Nature Communications. Well H4.

Counting cells can accurately predict small-molecule bioactivity benchmarks

Srijit Seal, William Dee, Adit Shah, Natacha Cerisier, Andrew Zhang, Esteban Miglietta, Katherine Titterton, Ángel Alexander Cabrera, Daniil Boiko, Alex Beatson, Gregory Slabaugh, Olivier Taboureau, Jordi Carreras Puigvert, Shantanu Singh, Ola Spjuth, Andreas Bender, Anne E. Carpenter

Read the paper

Caption

Performance of morphology- and structure-based models across diverse assay datasets and their association with cytotoxicity, apoptosis enrichment, and compound promiscuity. (a) The number of assays and (b) assay types predicted with AUC > 0.8 in the Hofmarcher dataset, (c) the number of assays with AUC > 0.7 in the Moshkov dataset, and (d) number of assays with AUC > 0.9 with linear probing models using CLOOME image and chemical structure-based embeddings in Sanchez-Fernandez et al compared to baseline cell count models. Multi-task neural network (results from Moshkov et al.) were trained using either CellProfiler morphological profiles which have been batch-corrected (MOBC), or gene expression data (GE). Baseline cell count models were trained only using the “Cells_Number_Object_Number” morphology feature (cell count). Differing AUC cutoffs are used to be consistent with the originally published results for each dataset. (e) Proportion of compounds enriched for apoptosis/cell death (red), other GO terms (blue), or no significant GO terms (gray), stratified by normalized cell counts bins, standardised against plate-specific DMSO controls. Compound counts per bin are shown above bars. Apoptosis-related enrichment exceeded 70% in two of the three lowest bins and declined with increasing cell count. (f) Similar analysis of compound promiscuity (i.e., number of active target labels for each compound). Apoptosis enrichment generally increases among compounds with an increase of active labels. (g) Euler diagram showing overlap between cytotoxic (n=1,520; orange) and promiscuous (n=24,606; blue) compounds, before (light) and after (dark) GO enrichment filtering. 214 compounds were shared between the two enriched subsets. (h) Heatmap showing apoptosis enrichment (%) across combinations of cell count bins and promiscuity bins. Each tile indicates the percentage and count (apoptosis / total). Color intensity reflects the level of apoptotic enrichment. FNN: Fully connected neural network, ResNet: residual neural network, CLOOME: Contrastive Learning and leave-One-Out-boost for Molecule Encoders.

Citation

Srijit Seal, William Dee, Adit Shah, Natacha Cerisier, Andrew Zhang, Esteban Miglietta, Katherine Titterton, Ángel Alexander Cabrera, Daniil Boiko, Alex Beatson, Gregory Slabaugh, Olivier Taboureau, Jordi Carreras Puigvert, Shantanu Singh, Ola Spjuth, Andreas Bender, Anne E. Carpenter. Counting cells can accurately predict small-molecule bioactivity benchmarks. Nature Communications 17, 2436 (2026). https://doi.org/10.1038/s41467-026-68725-5

Back to the plate

Figure 6 from A scalable approach to resolving variants of uncertain significance
Figure 6.

2026, bioRxiv. Well H5.

A scalable approach to resolving variants of uncertain significance

Malvika Tejura, Yile Chen, Abbye E. McEwen, Ross Stewart, Yuriy Sverchkov, Florent Laval, Ivan Woo, Daniel Zeiberg, Runxi Shen, Shawn Fayer, Jeremy Stone, Nahum Smith, Silvia Casadei, Ziyu R. Wang, Matthew W. Snyder, Benjamin J. Capodanno, Pankhuri Gupta, Mariam Benazouz, Shantanu Jain, Sarah Heidl, Lara Muffley, Shengcheng Dong, Benjamin C. Hitz, Idan Gabdank, Khine Lin, Estelle Y. Da, Sabrina Best, Sally Grindstaff, David Reinhart, Leslie Rodriguez-Salas, Obsa Seid, Allyssa J. Vandi, Cameron Wenman, Melinda K. Wheelock, Sriram Pendyala, Dan Holmes, Alicia Xu, Airi Hosokai, Maxime Tixhon, Chloe Reno, Jessica D. Ewald, Kerstin Spirohn-Fitzgerald, Tanisha Teelucksingh, Tong Hao, Zitong S. Chen, Marzieh Haghighi, Ahmad Kamal Hamid, Esteban A. Miglietta, Erin Weisbart, Georges Coppin, Luke Lambourne, Marinella Gebbia, Atina G. Coté, Warren van Loggerenberg, Kirby M. Fawcett, Robert D. Steiner, Jill M. Johnsen, Andrew B. Stergachis, Lilia M. Iakoucheva, Shantanu Singh, Beth A. Cimini, Frederick P. Roth, Richard G. James, the IGVF Coding Variants Focus Group, Marc Vidal, Mikko Taipale, Anne E. Carpenter, Michael A. Calderwood, Mark Craven, Vikas Pejaver, Alan F. Rubin, Predrag Radivojac, Douglas M. Fowler, Lea M. Starita

Read the paper

Caption

Experimental and predictive evidence can resolve ~75% of VUS and preclassify 62% of unobserved variants. (a) Sankey diagram depicting the relationship of ClinVar VUS and classifications using only experimental and predictive evidence. (b) Odds ratios for occurrence of disease in individuals in the All of Us biobank with variants meeting each indicated evidence strength threshold for genes that were found to have significant association with disease at some level of pathogenic evidence (Supplementary Data 2). X-axis denotes the odds ratio with the black vertical dashed line indicating an odds ratio of 1. Y-axis denotes the total evidence points for sets of variants. Circles denote the estimated odds ratio and whiskers denote the 95% confidence interval. (c) Donut plots summarizing the strength, source, and consistency of evidence across ClinVar VUS shown in (a). The inner ring denotes the cumulative evidence points assigned to variants. The middle ring indicates the source of evidence as indicated. The outer ring shows the number of variants with concordant (evidence in the same direction) versus conflicting (evidence in opposite directions) evidence for each evidence source category. (d) Sankey diagram depicting the relationship of gnomAD variants to classifications using only experimental and predictive evidence. (e) Sankey diagram depicting the relationship of unobserved variants to classifications using only experimental and predictive evidence.

Citation

Malvika Tejura, Yile Chen, Abbye E. McEwen, Ross Stewart, Yuriy Sverchkov, Florent Laval, Ivan Woo, Daniel Zeiberg, Runxi Shen, Shawn Fayer, Jeremy Stone, Nahum Smith, Silvia Casadei, Ziyu R. Wang, Matthew W. Snyder, Benjamin J. Capodanno, Pankhuri Gupta, Mariam Benazouz, Shantanu Jain, Sarah Heidl, Lara Muffley, Shengcheng Dong, Benjamin C. Hitz, Idan Gabdank, Khine Lin, Estelle Y. Da, Sabrina Best, Sally Grindstaff, David Reinhart, Leslie Rodriguez-Salas, Obsa Seid, Allyssa J. Vandi, Cameron Wenman, Melinda K. Wheelock, Sriram Pendyala, Dan Holmes, Alicia Xu, Airi Hosokai, Maxime Tixhon, Chloe Reno, Jessica D. Ewald, Kerstin Spirohn-Fitzgerald, Tanisha Teelucksingh, Tong Hao, Zitong S. Chen, Marzieh Haghighi, Ahmad Kamal Hamid, Esteban A. Miglietta, Erin Weisbart, Georges Coppin, Luke Lambourne, Marinella Gebbia, Atina G. Coté, Warren van Loggerenberg, Kirby M. Fawcett, Robert D. Steiner, Jill M. Johnsen, Andrew B. Stergachis, Lilia M. Iakoucheva, Shantanu Singh, Beth A. Cimini, Frederick P. Roth, Richard G. James, the IGVF Coding Variants Focus Group, Marc Vidal, Mikko Taipale, Anne E. Carpenter, Michael A. Calderwood, Mark Craven, Vikas Pejaver, Alan F. Rubin, Predrag Radivojac, Douglas M. Fowler, Lea M. Starita. A scalable approach to resolving variants of uncertain significance. bioRxiv (2026). https://doi.org/10.64898/2026.02.14.705848

Back to the plate

Figure 1 from Progress and new challenges in image-based profiling
Figure 1.

2026, Molecular Systems Biology. Well H6.

Progress and new challenges in image-based profiling

Erik Serrano, John Peters, Jesko Wagner, Rebecca E Graham, Zhenghao Chen, Brian Y Feng, Gisele Miranda, Alexandr A Kalinin, Loan Vulliard, Jenna Tomkinson, Cameron Mattson, Michael J Lippincott, Ziqi Kang, Divya Sitani, Dave Bunten, Srijit Seal, Neil O Carragher, Anne E Carpenter, Shantanu Singh, Paula A Marin Zapata, Juan C Caicedo, Gregory P Way

Read the paper

Caption

The comprehensive image-based profiling workflow. A complete image-based profiling workflow spans from A) experimental design, sample preparations and image acquisition to the generation of digitized cellular representations and B) their downstream processing steps.

Citation

Erik Serrano, John Peters, Jesko Wagner, Rebecca E. Graham, Zhenghao Chen, Brian Y. Feng, Gisele Miranda, Alexandr A. Kalinin, Loan Vulliard, Jenna Tomkinson, Cameron Mattson, Michael J. Lippincott, Ziqi Kang, Divya Sitani, Dave Bunten, Srijit Seal, Neil O. Carragher, Anne E. Carpenter, Shantanu Singh, Paula A. Marin Zapata, Juan C. Caicedo, Gregory P. Way. Progress and new challenges in image-based profiling. Molecular Systems Biology 22, 624-658 (2026). https://doi.org/10.1038/s44320-026-00197-7

Back to the plate

Figure 3 from Cell Painting for cytotoxicity and mode-of-action analysis in primary human hepatocytes
Figure 3.

2026, Cell Systems. Well H7.

Cell Painting for cytotoxicity and mode-of-action analysis in primary human hepatocytes

Jessica D. Ewald, Katherine L. Titterton, Alex Bäuerle, Alex Beatson, Daniil A. Boiko, Ángel A. Cabrera, Jaime Cheah, Beth A. Cimini, Bram L. Gorissen, Joshua Harrill, Thouis R. Jones, Konrad J. Karczewski, Christine E. Crute, David Rouquie, Srijit Seal, Erin Weisbart, Brandon White, Anne E. Carpenter, Shantanu Singh

Read the paper

Caption

Distributions of AUROC scores (A) and PRAUC scores (B). The morphology and cell count classifiers are trained on CellProfiler features and cell counts that were median-aggregated across all concentrations. The random baseline is trained on CellProfiler morphology features after randomly shuffling the labels. (C) Mean difference in classifier performance according to AUROC and PRAUC, stratified by endpoint type, compared to random and cell count baselines. Associated paired t-test p-values are in parentheses.

Citation

Jessica D. Ewald, Katherine L. Titterton, Alex Bäuerle, Alex Beatson, Daniil A. Boiko, Ángel A. Cabrera, Jaime Cheah, Beth A. Cimini, Bram L. Gorissen, Joshua Harrill, Thouis R. Jones, Konrad J. Karczewski, Christine E. Crute, David Rouquie, Srijit Seal, Erin Weisbart, Brandon White, Anne E. Carpenter, Shantanu Singh. Cell Painting for cytotoxicity and mode-of-action analysis in primary human hepatocytes. Cell Systems 17, 101566 (2026). https://doi.org/10.1016/j.cels.2026.101566

Back to the plate

Figure 1 from Understanding biology with machine learning: compression, intelligibility, and dependency
Figure 1.

2026, Artificial Intelligence in the Life Sciences. Well H8.

Understanding biology with machine learning: compression, intelligibility, and dependency

Elsa Lawrence, Adham El-Shazly, Srijit Seal, Chaitanya K Joshi, Pietro Liò, Andreas Bender, Shantanu Singh, Pietro Sormanni, Ola Spjuth, Matthew Greenig

Read the paper

Caption

Why ML can enhance understanding without deductive-nomological-style laws. (A) Deductive-nomological models: phenomena P are deduced from laws and boundary conditions (e.g., Snell's law explaining refraction, derived from Maxwell's equations). (B) Three manifestations of constraints on deductive-nomological explanation in biology: cross-scale non-decomposability (properties at different organizational levels resist micro-to-macro reduction), conditionality (in vitro findings often fail to extrapolate to in vivo contexts), and emergence (macromolecular properties resist prediction from component-level information). (C) Three non-explanatory routes to understanding mapped to ML practice: Compression (architectural invariances, dimensionality reduction), Intelligibility (visualization and qualitative reasoning), Dependency modeling (learned networks guiding intervention).

Citation

Elsa Lawrence, Adham El-Shazly, Srijit Seal, Chaitanya K. Joshi, Pietro Liò, Andreas Bender, Shantanu Singh, Pietro Sormanni, Ola Spjuth, Matthew Greenig. Understanding biology with machine learning: compression, intelligibility, and dependency. Artificial Intelligence in the Life Sciences 9, 100161 (2026). https://doi.org/10.1016/j.ailsci.2026.100161

Back to the plate

Figure 4 from Identifying and targeting abnormal mitochondrial localization associated with psychosis
Figure 4.

2026, bioRxiv. Well H9.

Identifying and targeting abnormal mitochondrial localization associated with psychosis

Marzieh Haghighi, Donna McPhie, Mohammad Rohban, Erin Weisbart, David J Logan, Kyle W Karhohs, Suzann M Babb, Jessica D Ewald, Johan Fredin Haslum, Caitlin Ravichandran, Beth A Cimini, Shantanu Singh, Bruce M Cohen, Anne E Carpenter

Read the paper

Caption

Localization of mitochondria differs in various patient groups experiencing psychiatric conditions. (a) Schematic illustrating how radial features are computed for MitoTracker staining using concentric rings from the nucleus to the cell border (4 bins shown for illustration; 12 bins are actually used in this study). MITO-SLOPE is defined as the slope of this feature pattern at the cell periphery (see Methods for definition), capturing differences in mitochondrial enrichment or depletion across groups. (b) Mean standardized values (± standard error) of 12 radial mitochondrial features (Cells_RadialDistribution_MeanFrac_mito_tubenessNNof12 where NN is the bin number), ordered from the edge of the nucleus (1of12) to the cell periphery (12of12), and standardized to the control group. Patients with bipolar disorder (BP, dark red) and schizophrenia (SZ, red) show a declining pattern at the cell periphery, indicating reduced mitochondrial density near the cell edge. In contrast, major depressive disorder (MDD, blue) shows increased peripheral mitochondrial signal. (c) The value of the MITO-SLOPE feature representing mitochondrial dispersion is shown for each patient (derived from the mean-averaged pattern across the cells within each patient) in each category. “Psychosis” includes the patients in the categories BP, SZ, and SZA. Box plots show the median and upper and lower quartiles and whiskers denote the 1.5× interquartile range. P-values are noted for each comparison to the control group.

Citation

Marzieh Haghighi, Donna McPhie, Mohammad Rohban, Erin Weisbart, David J. Logan, Kyle W. Karhohs, Suzann M. Babb, Jessica D. Ewald, Johan Fredin Haslum, Caitlin Ravichandran, Beth A. Cimini, Shantanu Singh, Bruce M. Cohen, Anne E. Carpenter. Identifying and targeting abnormal mitochondrial localization associated with psychosis. bioRxiv (2026). https://doi.org/10.1101/2025.10.08.676630

Back to the plate

Figure 1 from JUMP Cell Painting chemical dataset: Morphological map of 115,796 compounds in human cells
Figure 1.

2026, bioRxiv. Well H10.

JUMP Cell Painting chemical dataset: Morphological map of 115,796 compounds in human cells

Srinivas Niranj Chandrasekaran, Srijit Seal, Jeanelle Ackerman, Lakshmi B. Akella, David Alencar Araripe, Eric Alix, D. Michael Ando, John Arevalo, Melissa Bennion, Nicolas Boisseau, Adriana Borowa, Justin D. Boyd, Laurent Brino, Patrick J. Byrne, Hugo Ceulemans, Carolyn Ch’ng, Beth A. Cimini, Djork-Arne Clevert, Nicole Deflaux, John G. Doench, Thierry Dorval, Regis Doyonnas, Vincenza Dragone, Ola Engkvist, Patrick W. Faloon, Johan Fredin Haslum, Briana Fritchman, Florian Fuchs, Sakshi Garg, Tamara J. Gilbert, David Glazer, David Gnutt, Jonathan T. Goldstein, Amy Goodale, Jeremy Grignard, Judith Guenther, Yu Han, Zahra Hanifehlou, Santosh Hariharan, Joshua A. Harrill, Desiree Hernandez, Shane R. Horman, Gisela Hormel, Michael Huntley, Ilknur Icke, Makiyo Iida, Christina B. Jacob, Steffen Jaensch, Isabel S. Jerchel-Furau, Alexandr A. Kalinin, Jawahar Khetan, Maria Kost-Alimova, Tomasz Krawiec, Daniel Kuhn, Charles-Hugues Lardeau, Amanda Lembke, Francis Lin, Kevin D. Little, Gang Liu, Kenneth R. Lofstrom, David J. Logan, Sofia Lotfi, Yi Luo, Franck Madoux, Paula A. Marin Zapata, Brittany A. Marion, Glynn Martin, Nicola J. McCarthy, Lewis Mervin, Lisa Miller, Haseeb Mohamed, Tiziana Monteverde, Elizabeth Mouchet, Alán F. Muñoz, Barbara Nicke, Arnaud Ogier, Anne-Laure Ong, Marc Osterland, Magdalena Otrocka, Constantia Pantelidou, Pieter J. Peeters, James Pilling, Stefan Prechtl, Chen Qian, Krzysztof Rataj, David E. Root, Sylvie K. Sakata, Simon Scrace, Rebecca A. Senft, Runxi Shen, Hajime Shimizu, David Simon, Suganya Sivagurunathan, Peter Sommer, Craig Spruiell, Iffat Sumia, Susanne E. Swalley, Stephanie Tang, Hiroki Terauchi, Amandine Thibaudeau, Amy Unruh, Jelle Van de Waeter, Michiel Van Dyck, Carlo van Staden, Gerard J. P. van Westen, Michał Warchoł, Erin Weisbart, Amélie Weiss, Nicolas Wiest-Daessle, Guy Williams, Shan Yu, Bolek Zapiec, Igor Zlobine, Marek Żyła, Shantanu Singh, Anne E. Carpenter

Read the paper

Caption

The JUMP consortium generated Cell Painting data for 115,796 compounds in cpg0016-jump. (A) The JUMP Cell Painting dataset includes cpg0000, cpg0001, cpg0002, and cpg0016 (Methods). This study presents the 115,796 chemical compounds of cpg0016, generated across the 12 partner sources/laboratories (note: Source 7 and 13 correspond to the same laboratory). Typically, five replicates of each compound were generated at two to four laboratories besides the one that nominated the compound. The arrows denote the compound exchange logistics (Supplementary Table 1) and apply only to the ten wave 1/wave 2 nominated-compound sources; S4, S7, and S13 did not participate in that exchange. cpg0016 genetic perturbations were previously published 21: CRISPR data generated entirely at S13 and ORFs at S4, the Broad. The size and overlaps in the schematic are not precise to scale. Overlap is also shown for cpg0012 20, Broad’s existing public dataset of 30,616 bioactive compounds, reprocessed using the JUMP processing pipeline (Methods). (B) Example Cell Painting images. Top: One negative control field of view (DMSO, dimethyl sulfoxide) showing the five imaged channels, pseudocolored, plus their merge. Bottom: visually strong phenotypes in each channel for various compounds. Single-channel and merged images were individually scaled to the 99th intensity percentiles and full intensity range of the image for visibility, respectively. All images are from a single source (S5) for consistency. Scale bars = 25 μm. (C-F) Chemical characterization of the 112,462 analyzed JUMP compounds: (C) Median physicochemical properties: QED (Quantitative Estimate of Drug-likeness 24); MW (molecular weight); LogP (calculated octanol-water partition coefficient); TPSA (topological polar surface area); HBD (hydrogen-bond donors); HBA (hydrogen-bond acceptors). (D) Lipinski rule-of-five (Ro5) compliance. (E) Clinical development stage for the 1,731 compounds with such annotation. (F) Number and percentage of compounds with a target or mechanism of action (MOA) annotation from the Drug Repurposing Hub, ChEMBL, the Chemical Probes Portal, and MOTIVE.

Citation

Srinivas Niranj Chandrasekaran, Srijit Seal, Jeanelle Ackerman, Lakshmi B. Akella, David Alencar Araripe, Eric Alix, D. Michael Ando, John Arevalo, Melissa Bennion, Nicolas Boisseau, Adriana Borowa, Justin D. Boyd, Laurent Brino, Patrick J. Byrne, Hugo Ceulemans, Carolyn Ch’ng, Beth A. Cimini, Djork-Arne Clevert, Nicole Deflaux, John G. Doench, Thierry Dorval, Regis Doyonnas, Vincenza Dragone, Ola Engkvist, Patrick W. Faloon, Johan Fredin Haslum, Briana Fritchman, Florian Fuchs, Sakshi Garg, Tamara J. Gilbert, David Glazer, David Gnutt, Jonathan T. Goldstein, Amy Goodale, Jeremy Grignard, Judith Guenther, Yu Han, Zahra Hanifehlou, Santosh Hariharan, Joshua A. Harrill, Desiree Hernandez, Shane R. Horman, Gisela Hormel, Michael Huntley, Ilknur Icke, Makiyo Iida, Christina B. Jacob, Steffen Jaensch, Isabel S. Jerchel-Furau, Alexandr A. Kalinin, Jawahar Khetan, Maria Kost-Alimova, Tomasz Krawiec, Daniel Kuhn, Charles-Hugues Lardeau, Amanda Lembke, Francis Lin, Kevin D. Little, Gang Liu, Kenneth R. Lofstrom, David J. Logan, Sofia Lotfi, Yi Luo, Franck Madoux, Paula A. Marin Zapata, Brittany A. Marion, Glynn Martin, Nicola J. McCarthy, Lewis Mervin, Lisa Miller, Haseeb Mohamed, Tiziana Monteverde, Elizabeth Mouchet, Alán F. Muñoz, Barbara Nicke, Arnaud Ogier, Anne-Laure Ong, Marc Osterland, Magdalena Otrocka, Constantia Pantelidou, Pieter J. Peeters, James Pilling, Stefan Prechtl, Chen Qian, Krzysztof Rataj, David E. Root, Sylvie K. Sakata, Simon Scrace, Rebecca A. Senft, Runxi Shen, Hajime Shimizu, David Simon, Suganya Sivagurunathan, Peter Sommer, Craig Spruiell, Iffat Sumia, Susanne E. Swalley, Stephanie Tang, Hiroki Terauchi, Amandine Thibaudeau, Amy Unruh, Jelle Van de Waeter, Michiel Van Dyck, Carlo van Staden, Gerard J. P. van Westen, Michał Warchoł, Erin Weisbart, Amélie Weiss, Nicolas Wiest-Daessle, Guy Williams, Shan Yu, Bolek Zapiec, Igor Zlobine, Marek Żyła, Shantanu Singh, Anne E. Carpenter. JUMP Cell Painting chemical dataset: Morphological map of 115,796 compounds in human cells. bioRxiv (2026). https://doi.org/10.1101/2023.03.23.534023

Back to the plate
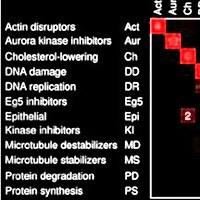
Figure 1 from Average precision under random ranking: baseline, variability, and formal verification
Figure 1.

2026, Manuscript and computational supplement, version 1.0.2, Broad Institute of MIT and Harvard. Well H11.

Average precision under random ranking: baseline, variability, and formal verification

Shantanu Singh

Read the paper

Caption

Exact moments and a discrete AP law. (A) Mean divided by prevalence for M/L = 0.1 and for M = 3. (B) Variance multiplied by L; dotted lines mark the respective limits 0.09 and π2/18. (C) All 28 label vectors with L = 8, M = 2 produce 26 distinct AP values; equal values are combined into probability masses. The dashed line is the mean, and the shaded band is one standard deviation on either side.

Citation

Shantanu Singh. Average precision under random ranking: baseline, variability, and formal verification. Manuscript and computational supplement, version 1.0.2, Broad Institute of MIT and Harvard (2026). https://github.com/shntnu/expected_ap/releases/tag/v1.0.2

Back to the plate
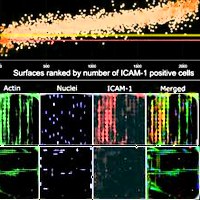
Drawings from Propel
Drawings.

2026, Essay. Well H12.

Propel

Jackson Weir, Matteo Di Bernardo, Yasha Ektefaie, Arya Rao, Luca Pinello, Shantanu Singh

Read the essay
Caption

The essay's six line drawings, one for each of the first questions, clockwise from the top: spatial genomics, liver toxicity, regulatory DNA across cell types, optical pooled screening, rapid experimental loops, and human adaptation. The drawings are from the essay, and the ring was arranged for this tribute.
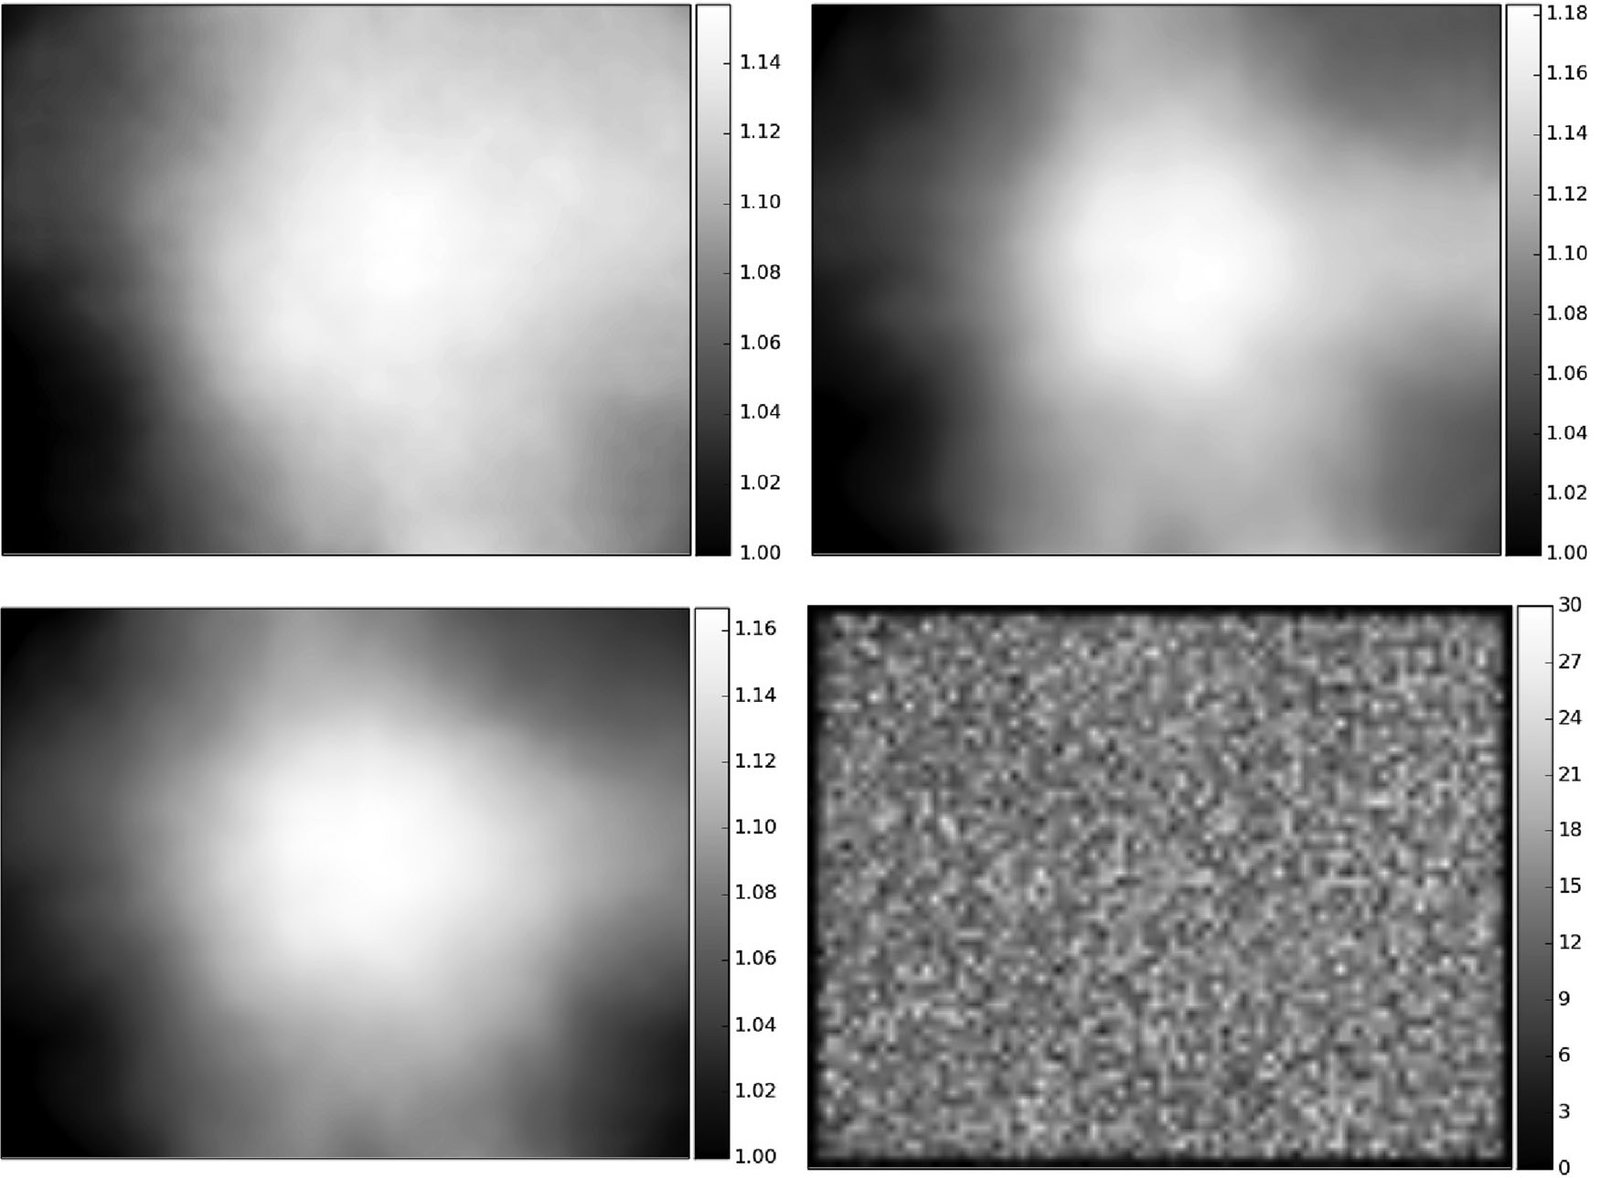
Citation

Jackson Weir, Matteo Di Bernardo, Yasha Ektefaie, Arya Rao, Luca Pinello, Shantanu Singh. Propel. Essay (2026). https://shntnu.bio/propel/

Back to the plate